Decorate your matplotlib bar charts : step-by-step guide
This is another guide to decorate matplotlib bar charts. We will basically apply path effects, using packages like mpl-visual-context and mpl_pe_fancy_bar. And we will do it step by step.
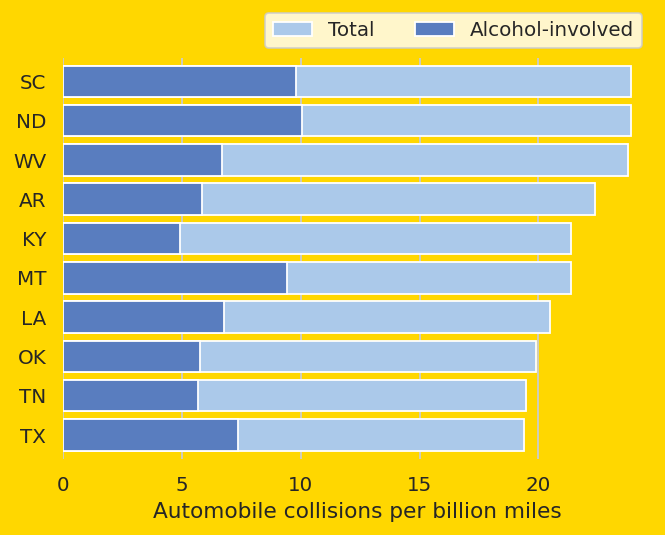
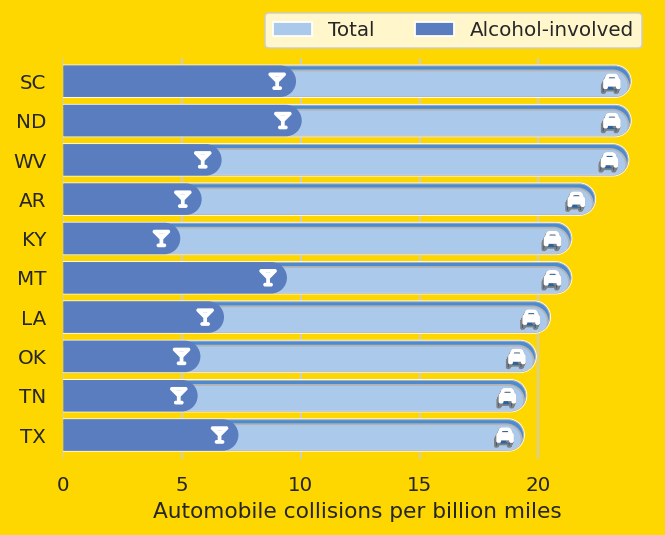
import numpy as npimport seaborn as snsimport matplotlib.pyplot as pltsns.set_theme(style="whitegrid")# Load the example car crash datasetcrashes = sns.load_dataset("car_crashes").sort_values("total", ascending=False).iloc[:10]# Initialize the matplotlib figurefig, ax = plt.subplots(num=1, clear=True, figsize=(5, 4), layout="constrained")fc ="gold"fig.patch.set_fc(fc)ax.patch.set_visible(False) # fc(fc)# Plot the total crashessns.set_color_codes("pastel")sns.barplot(x="total", y="abbrev", data=crashes, label="Total", color="b")# Plot the crashes where alcohol was involvedsns.set_color_codes("muted")sns.barplot(x="alcohol", y="abbrev", data=crashes, label="Alcohol-involved", color="b")# Add a legend and informative axis labelax.legend(ncol=2, loc="lower right", frameon=True, bbox_to_anchor=[1, 1])ax.set(xlim=(0, 24.8), ylim=(9.6, -0.6), ylabel="", xlabel="Automobile collisions per billion miles")sns.despine(left=True, bottom=True)
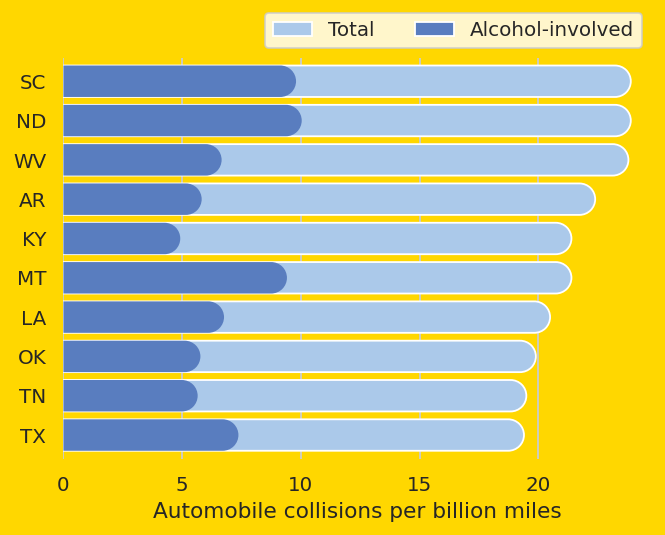
Make it round
mpl-pe-fancy-bar module contains patheffects that transform a simple rectangle path to a more complicated one. Below, we will use BarToRoundBar that transform a rectabngle to a rounded one. We will also use patheffects from the mpl-visual-context. FillOnly will only fill the path without a stroke.
import mpl_visual_context.patheffects as pefrom mpl_pe_fancy_bar import BarToRoundBarbar_containers_total = ax.containers[0]bar_containers_alcohol = ax.containers[1]round_bar = BarToRoundBar(orientation="horizontal", dh=0.5)pe1 = [ round_bar,]for p in bar_containers_total: p.set_path_effects(pe1)pe2 = [ round_bar | pe.FillOnly(),]for p in bar_containers_alcohol: p.set_path_effects(pe2)
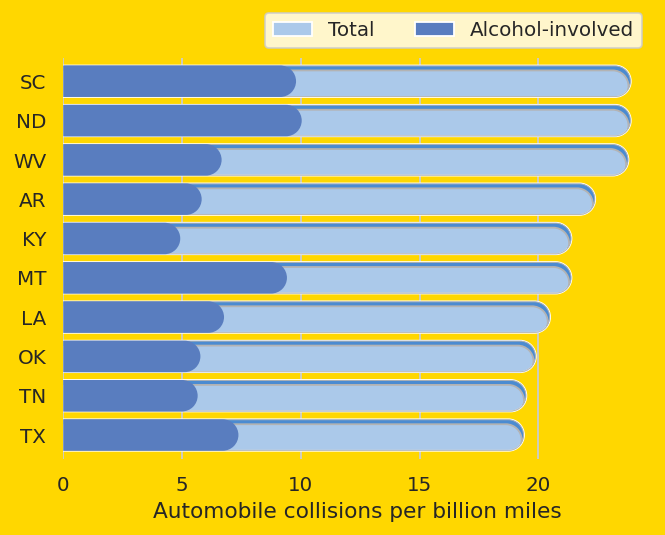
Simple debossing effect
We will add naive debossing effect by adding a shadow effect that is clipped by the path itself. Note the order of clipping and the shdow. The clip path effect will copy the current path, so the clipping path won’t be affected by any path transformation in the downstream. The shadow patheffect will result in the path that can be filled to give some shadow effect (e.g., this example )
from mpl_visual_context.patheffects_shadow import ShadowPathshadow = ShadowPath(115, 3)pe1 = [ round_bar, round_bar | pe.ClipPathSelf() | shadow | pe.HLSModify(l="70%"),]for p in bar_containers_total: p.set_path_effects(pe1)pe2 = [ round_bar | pe.FillOnly(),]for p in bar_containers_alcohol: p.set_path_effects(pe2)
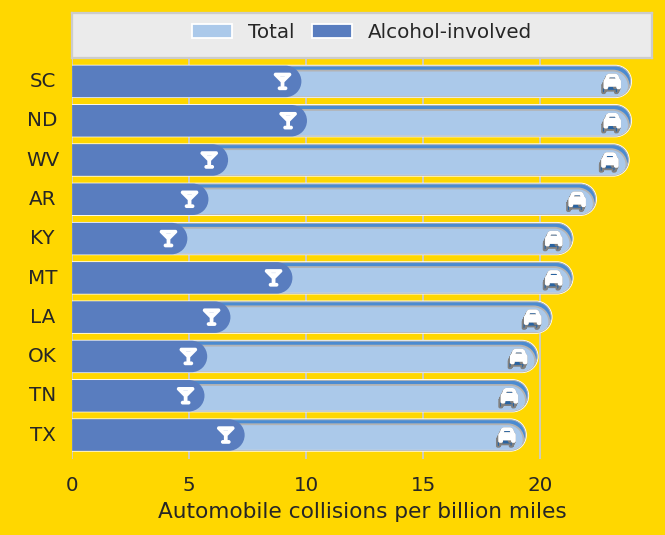
Add SVG Icons
Let’s add car icons to the bars. There could be different ways. We use BarWithIcon class. The advantage of this is that the size of icon will automatically scale relative to the width of the bars.
We will also change the look of legend. We will use panel feature of mpl_visual_context, which we won’t address its detail. In short, panel is an axes that is located next to the main axes, which is meant to display ticks and labels as annotations for more flexibility. Take a look at these examples (ex1 and ex2).