Using ColorEmoji in Matplotlib
In previous post, we introduced mpl-simple-svg-parser package that lets you render svg. You can further use this to render color emoji.
You will need a color emoji font with COLR table. For example, Noto Color Emoji can be downaloaded from https://fonts.google.com/noto/specimen/Noto+Color+Emoji
You can transform the glyphs in the font to SVG, and uses mpl-simple-svg-parser, for example, to render it with matplotlib.
mpl-colr2svg is a package that does this. To convert emoji to svg, it uses nanoemoji . Altenatively, it can use blackrenderer to render emoji font to svg.
Code
import matplotlib.pyplot as pltimport pandas as pd= [["😂" , 223.94 ],"🤣" , 170.29 ],"❤️" , 95.02 ],"🙏" , 116.92 ],"😭" , 95.02 ],"😍" , 77.3 ],"✨" , 76.34 ],"🔥" , 71.52 ],"😊" , 70.15 ],"🥰" , 67.35 ],= pd.DataFrame(emoji_popularity, columns= ["Emoji" , "Popularity" ])import seaborn as sns"muted" )set (font_scale = 1.5 )= plt.subplots(1 , 1 , figsize= (7 , 4 ), clear= True , num= 2 , layout= "constrained" )= "Emoji" , y= "Popularity" , data= df,= "Emoji Popularity" , color= "b" )from mpl_colr2svg import ColorEmoji= "NotoColorEmoji-Regular.ttf" = 25 = ColorEmoji(ftname)for l in ax.get_xticklabels():= l.get_text()= l.get_position()False )= ("data" , "axes fraction" ),= (0.5 , 1 ), fontsize= fontsize,= True )= fontsize * 1.7
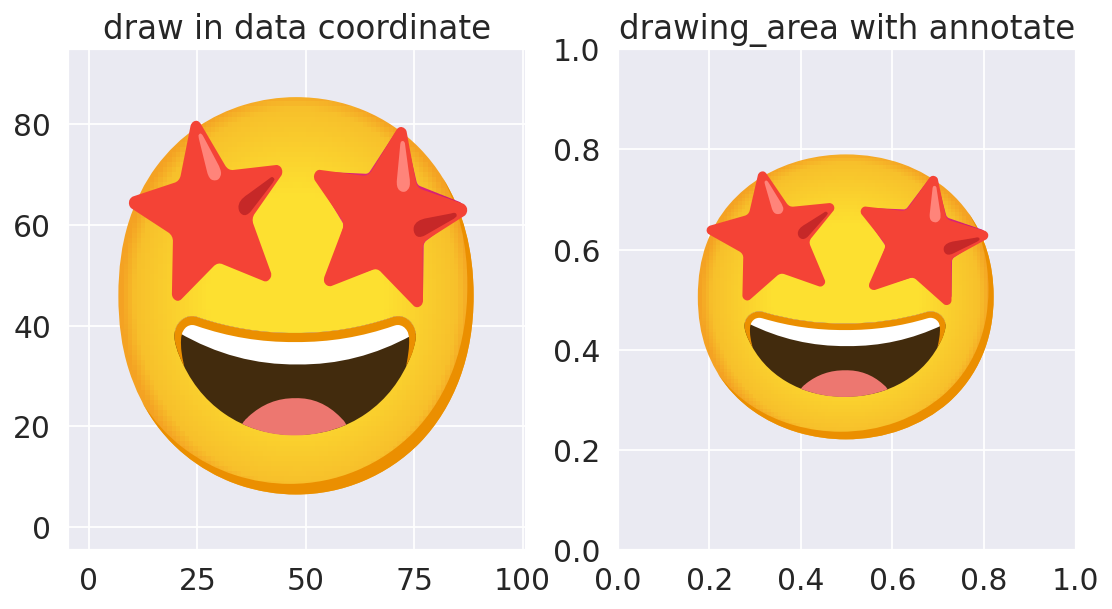
Let’s start with a simple example.
import matplotlib.pyplot as pltfrom mpl_colr2svg import ColorEmoji= "NotoColorEmoji-Regular.ttf" = ColorEmoji(ftname)= "🤩" = plt.subplots(1 , 2 , figsize= (10 , 5 ), clear= True , num= 1 )= axs[0 ]"draw in data coordinate" )= 128 )= axs[1 ]0.5 , 0.5 ), fontsize= 128 )"drawing_area with annotate" )
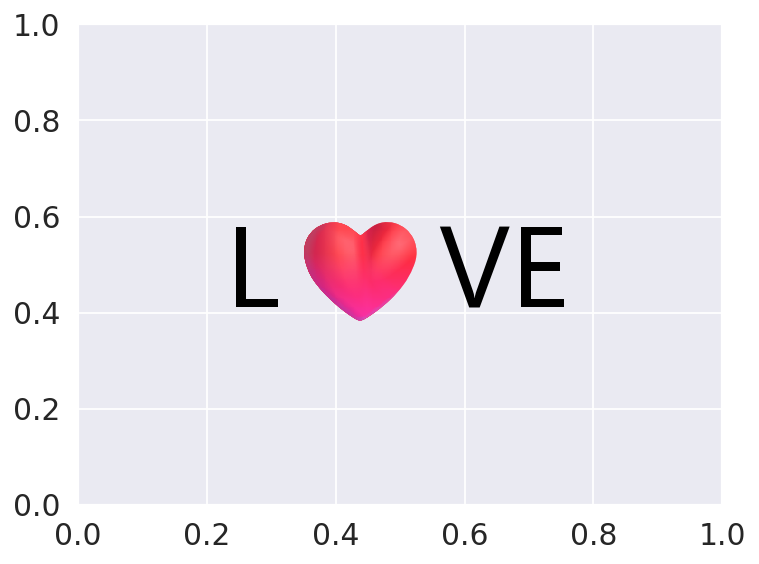
You may use blackrender. The default ColorEmoji only support a sing glyph, but the blackrenderer version supports string of multiple charaters.
import matplotlib.pyplot as pltfrom mpl_colr2svg.color_emoji_blackrenderer import ColorEmojiBlackrenderer= "seguiemj.ttf" = ColorEmojiBlackrenderer(ftname)= "L❤️VE" = plt.subplots(1 , 1 , clear= True , num= 1 )0.5 , 0.5 ), fontsize= 128 )
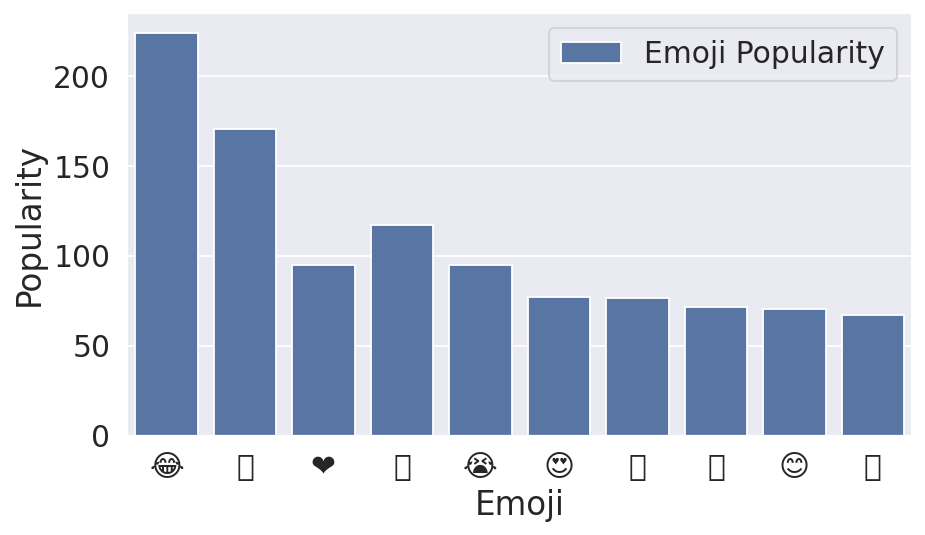
Here is a more useful example. We start with a seabron plot of emoji popularity.
import matplotlib.pyplot as pltimport pandas as pd= [["😂" , 223.94 ],"🤣" , 170.29 ],"❤️" , 95.02 ],"🙏" , 116.92 ],"😭" , 95.02 ],"😍" , 77.3 ],"✨" , 76.34 ],"🔥" , 71.52 ],"😊" , 70.15 ],"🥰" , 67.35 ],= pd.DataFrame(emoji_popularity, columns= ["Emoji" , "Popularity" ])import seaborn as sns"muted" )set (font_scale = 1.5 )= plt.subplots(1 , 1 , figsize= (7 , 4 ), clear= True , num= 2 , layout= "constrained" )= "Emoji" , y= "Popularity" , data= df,= "Emoji Popularity" , color= "b" )
<Axes: xlabel='Emoji', ylabel='Popularity'>
/home/jjlee/miniconda3/envs/mpl-dev/lib/python3.10/site-packages/IPython/core/events.py:82: UserWarning: Glyph 129315 (\N{ROLLING ON THE FLOOR LAUGHING}) missing from font(s) DejaVu Sans.
  func(*args, **kwargs)
/home/jjlee/miniconda3/envs/mpl-dev/lib/python3.10/site-packages/IPython/core/events.py:82: UserWarning: Glyph 128591 (\N{PERSON WITH FOLDED HANDS}) missing from font(s) DejaVu Sans.
  func(*args, **kwargs)
/home/jjlee/miniconda3/envs/mpl-dev/lib/python3.10/site-packages/IPython/core/events.py:82: UserWarning: Glyph 10024 (\N{SPARKLES}) missing from font(s) DejaVu Sans.
  func(*args, **kwargs)
/home/jjlee/miniconda3/envs/mpl-dev/lib/python3.10/site-packages/IPython/core/events.py:82: UserWarning: Glyph 128293 (\N{FIRE}) missing from font(s) DejaVu Sans.
  func(*args, **kwargs)
/home/jjlee/miniconda3/envs/mpl-dev/lib/python3.10/site-packages/IPython/core/events.py:82: UserWarning: Glyph 129392 (\N{SMILING FACE WITH SMILING EYES AND THREE HEARTS}) missing from font(s) DejaVu Sans.
  func(*args, **kwargs)
/home/jjlee/miniconda3/envs/mpl-dev/lib/python3.10/site-packages/IPython/core/pylabtools.py:152: UserWarning: Glyph 129315 (\N{ROLLING ON THE FLOOR LAUGHING}) missing from font(s) DejaVu Sans.
  fig.canvas.print_figure(bytes_io, **kw)
/home/jjlee/miniconda3/envs/mpl-dev/lib/python3.10/site-packages/IPython/core/pylabtools.py:152: UserWarning: Glyph 128591 (\N{PERSON WITH FOLDED HANDS}) missing from font(s) DejaVu Sans.
  fig.canvas.print_figure(bytes_io, **kw)
/home/jjlee/miniconda3/envs/mpl-dev/lib/python3.10/site-packages/IPython/core/pylabtools.py:152: UserWarning: Glyph 10024 (\N{SPARKLES}) missing from font(s) DejaVu Sans.
  fig.canvas.print_figure(bytes_io, **kw)
/home/jjlee/miniconda3/envs/mpl-dev/lib/python3.10/site-packages/IPython/core/pylabtools.py:152: UserWarning: Glyph 128293 (\N{FIRE}) missing from font(s) DejaVu Sans.
  fig.canvas.print_figure(bytes_io, **kw)
/home/jjlee/miniconda3/envs/mpl-dev/lib/python3.10/site-packages/IPython/core/pylabtools.py:152: UserWarning: Glyph 129392 (\N{SMILING FACE WITH SMILING EYES AND THREE HEARTS}) missing from font(s) DejaVu Sans.
  fig.canvas.print_figure(bytes_io, **kw)
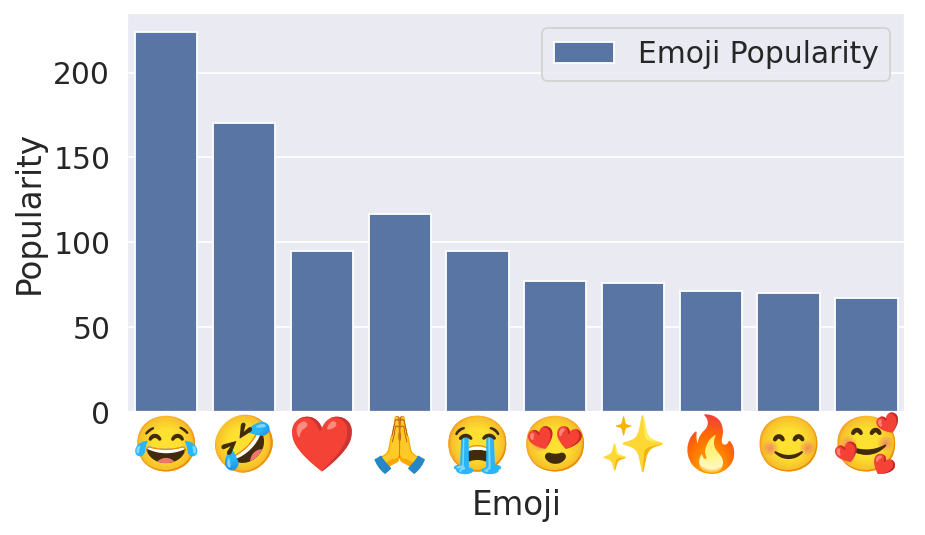
Don’t worry if you see tofus. We will replace the x-tick labels with color emoji.
from mpl_colr2svg import ColorEmoji= "NotoColorEmoji-Regular.ttf" = 25 = ColorEmoji(ftname)for l in ax.get_xticklabels():= l.get_text()= l.get_position()False )= ("data" , "axes fraction" ),= (0.5 , 1 ), fontsize= fontsize,= True )= fontsize * 1.7