While there are other ways to change the fill-colors and edge-colors of the patches, in this example, we will use patheffect. There are pros and cons. The disadvantages would be that it will increase the runtime performance. Advantage would be that it will keep its original color.
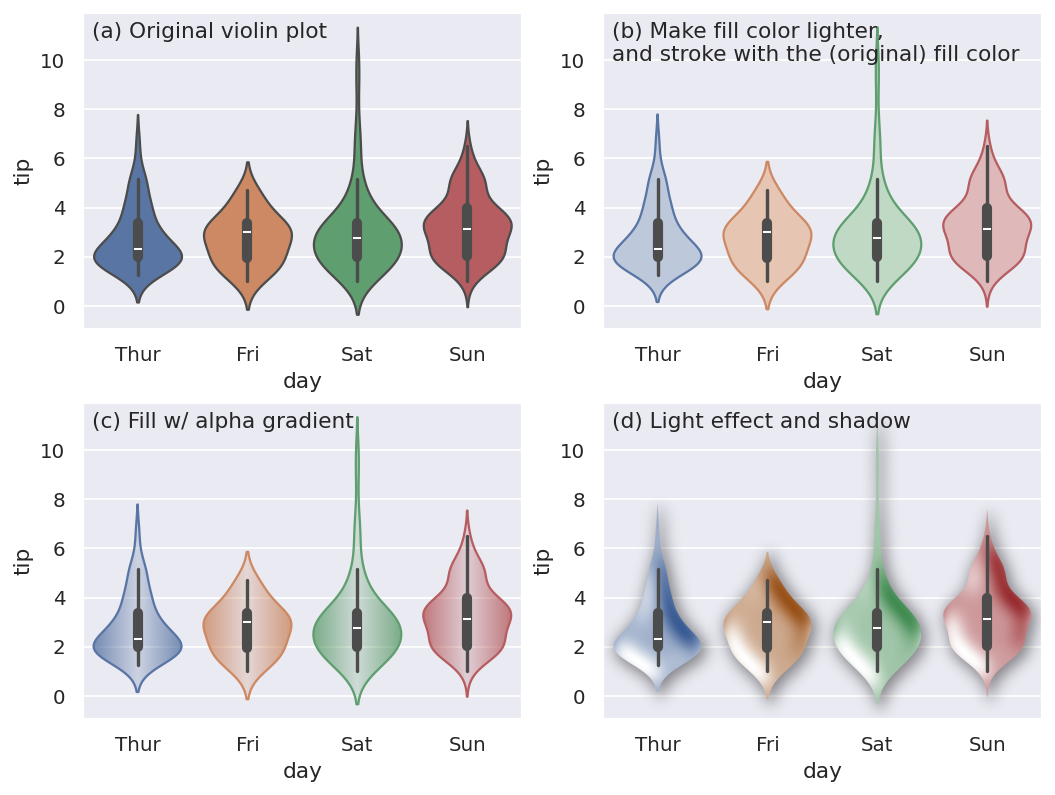
Simple patheffect with mpl-visual-context: change color
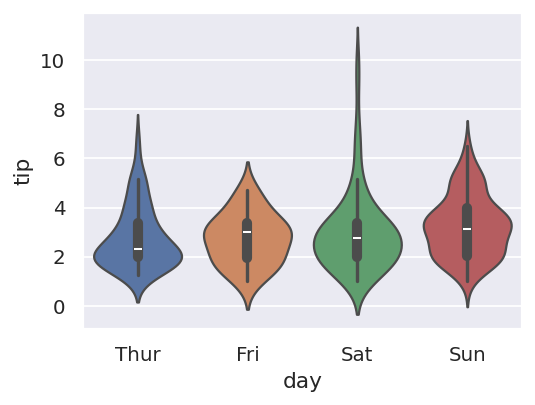
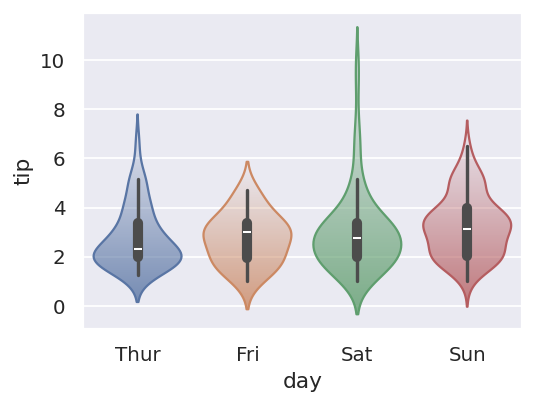
Let’s start with a simple example
The default edge color is black, let’s sync it to that of the facecolor. We will use mpl-visual-context module, which implements composable patheffects, i.e., it implements various patheffects that can do simple thins and the can be pipelined to make complex patheffects.
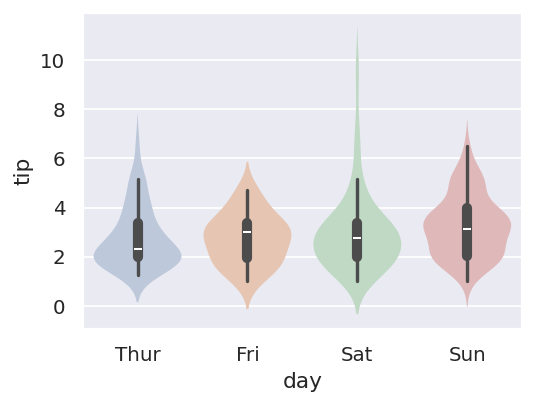
import mpl_visual_context.patheffects as pecolls = ax.collectionspe_list = [ pe.HLSModify(l=0.8) | pe.FillOnly()]for coll in colls: coll.set_path_effects(pe_list)
HLSModify change the color (both fillcolor and edgecolor) in the HLS space. It will set the lightness to 0.8, making the color brighter. And, FillOnly will fill the path without stroking. By pipelining two patheffects with |, we create a new pathe effect that fills the path with a lighter color.
Note that we iterate over ax.collections, but ax.collections seem to have different artists based on the seaborn version. So, you may need to iterate over a subset of collections.
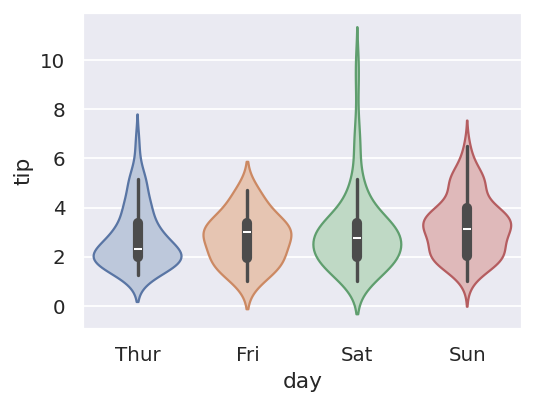
set_path_effects takes a list of patheffects. And the same path is drawn with different patheffects in sequence. So, let’s add another patheffect. The default edgecolor was black, and we will change the edgecolor to the original fillcolor. StrokeColorFromFillColor will set the edgecolor to that of fillcolor and StrokeOnly will simply stroke the path without filling.
mpl-visual-context` contains various patheffects. Check out https://mpl-visual-context.readthedocs.io/en/latest/api_path_effect.html for the list of available patheffects.
Image-based patheffects
mpl-visual-context also contains image-base patheffects. Note that these effects won’t draw the path in vector format. Instead, it will rasterize the path and apply filters in image plane then the image is drawn on the canvas. Therefore, in most case, these image-base patheffect should be placed at the end of the pipeline.
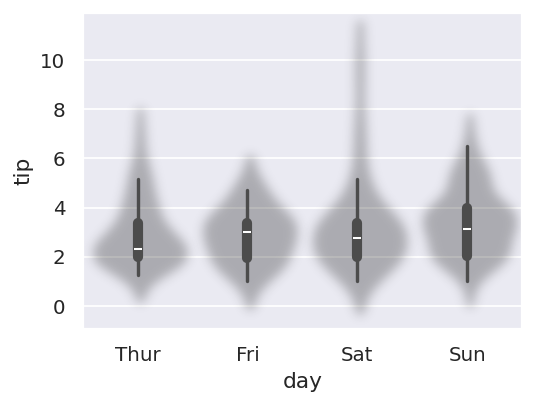
Let’s apply some alpha gradient to the fill. AlphaGradient will make an image of the fill color and adjust the alpha channel of the images. For example, ‘0.8 > 0.2 > 0.8’ means alpha horizontal gradient starting from 0.8 on the left, 0.2 at the center and 0.8 at the right.
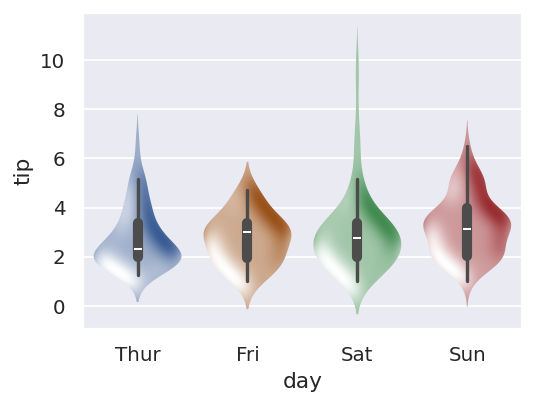
You can also do vertical gradient. Instead of ‘>’ use ‘^’. For example, ‘0.8 ^ 0’ means alpha of 0.8 at the bottom and 0 at the top. Note that the image is created with extent of the artist.
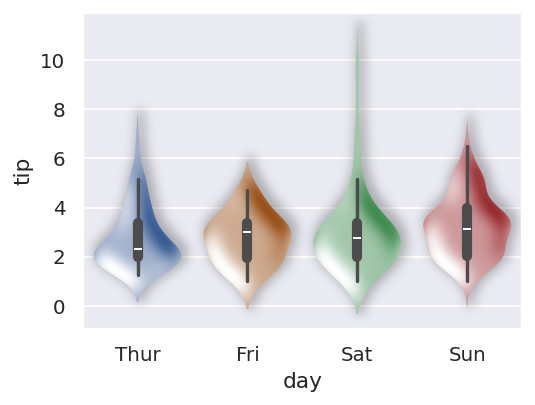
AlphaGradient is a special case of an ImageEffect patheffect. In fact, ImageEffect implements various effects in image plane that can be pipelined (similar to patheffects)
To make it more fancy, we can add light effect. It is based on matplotlib.colors.LightSource. https://matplotlib.org/stable/api/_as_gen/matplotlib.colors.LightSource.html