%matplotlib inlineIn this post, I will introduce mpl-speech-bubble package.
You can install it by
pip install mpl-speech-bubble
And the source code can be found at https://github.com/leejjoon/mpl-speech-bubble and documentation at https://mpl-speech-bubble.readthedocs.io/ (documentation is far from complete)
With mpl-speech-bubble, you can annotate you Matplotlib plot with speech bubbles, like this

Let’s start with a Matplotlib’s annotate example. Note that we use “wedge” arrow style.
import matplotlib.pyplot as plt

fig, ax = plt.subplots(num=1, clear=True)

xy = (0.2, 0.5)
ax.plot([xy[0]], [xy[1]], "o")

annotate_kwargs = dict(
    ha="center", va="bottom",
    size=20,
    bbox=dict(boxstyle="round, pad=0.2",
              fc="w", ec="k"),
    arrowprops=dict(
        arrowstyle="wedge, tail_width=0.5",
        fc="y",
        patchA=None, # by default, annotate set patchA to the bbox.
    )
)

t = ax.annotate(
    text="Default",
    xy=xy, xycoords='data',
    xytext=(-0., .9), textcoords="offset fontsize",
    **annotate_kwargs
)

ax.set_xlim(0, 1)
(0.0, 1.0)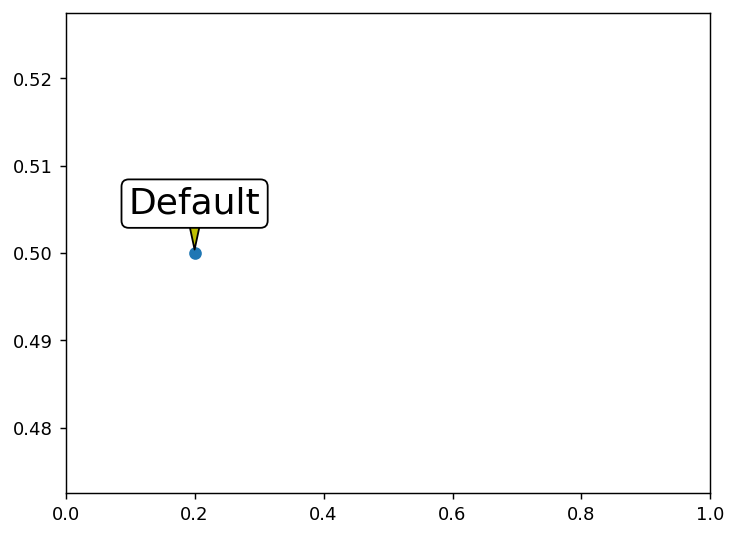
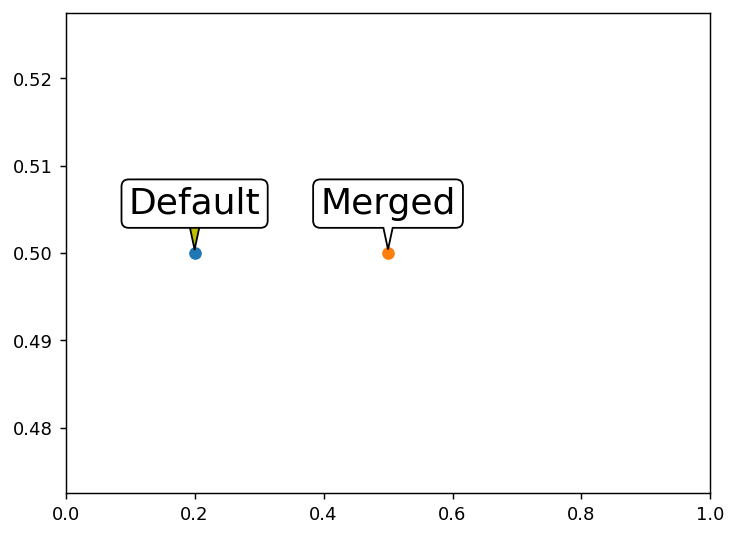
mpl-speech-bubble has a function annotate_merged. This fucntion is mostly identical to MPL’s annotate, and at the drawing time, it will merge the bbox patch and the arrow patch. Behind the scence, it uses skia-pathops to merge bezier paths. The properties of merged patch will inherid from the bbox patch.
from mpl_speech_bubble import annotate_merged

xy = (0.5, 0.5)
ax.plot([xy[0]], [xy[1]], "o")

t = annotate_merged(
    ax,
    text="Merged",
    xy=xy, xycoords='data',
    xytext=(-0., .9), textcoords="offset fontsize",
    **annotate_kwargs
)
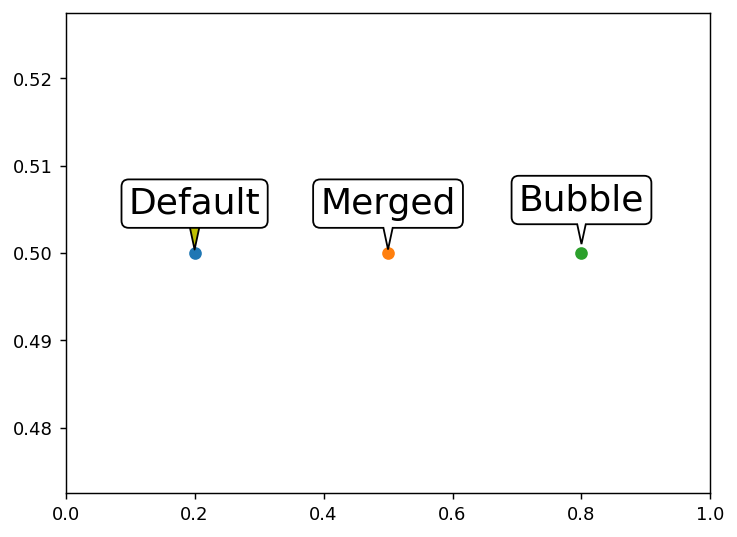
In addtion, it provides annotate-bubble function. It has slghtly different call signature from annotate, but has an advantage of better handling of things like rotation.
Instead of xytext and textcoords, you should use loc and dist. The unit of dist is fontsize.
from mpl_speech_bubble import annotate_bubble

xy = (0.8, 0.5)
ax.plot([xy[0]], [xy[1]], "o")

t = annotate_bubble(
    ax,
    text="Bubble",
    xy=xy, xycoords='data',
    loc="up", dist=1.,
    size=20,
)
t = annotate_bubble(
    ax,
    text="Bubble 2",
    xy=xy, xycoords='data',
    loc="down", dist=1.,
    size=20, rotation=30,
)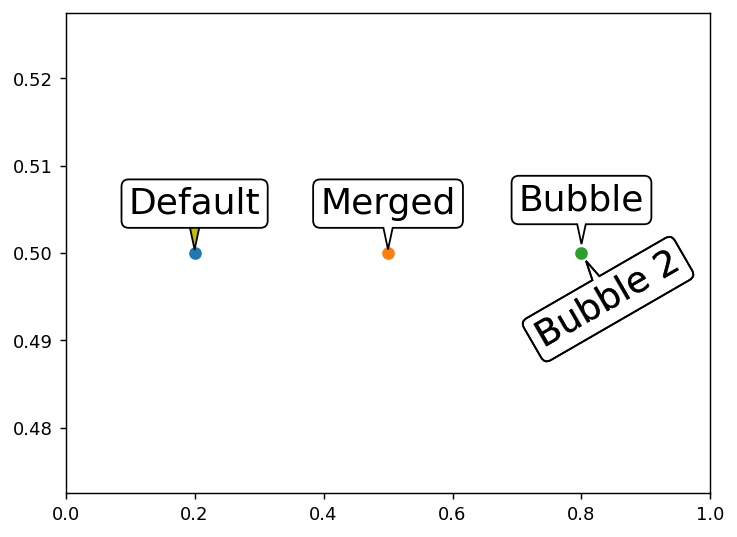
annotate_bubble is a simple wrapper around AnnotationBubble class. Please take a look at the example here