pywcsgrid2.axes_wcs
- class pywcsgrid2.axes_wcs.GridHelperWcsBase(wcs, axis_nums=None)
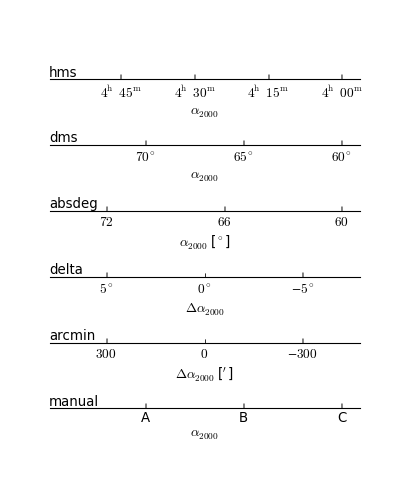
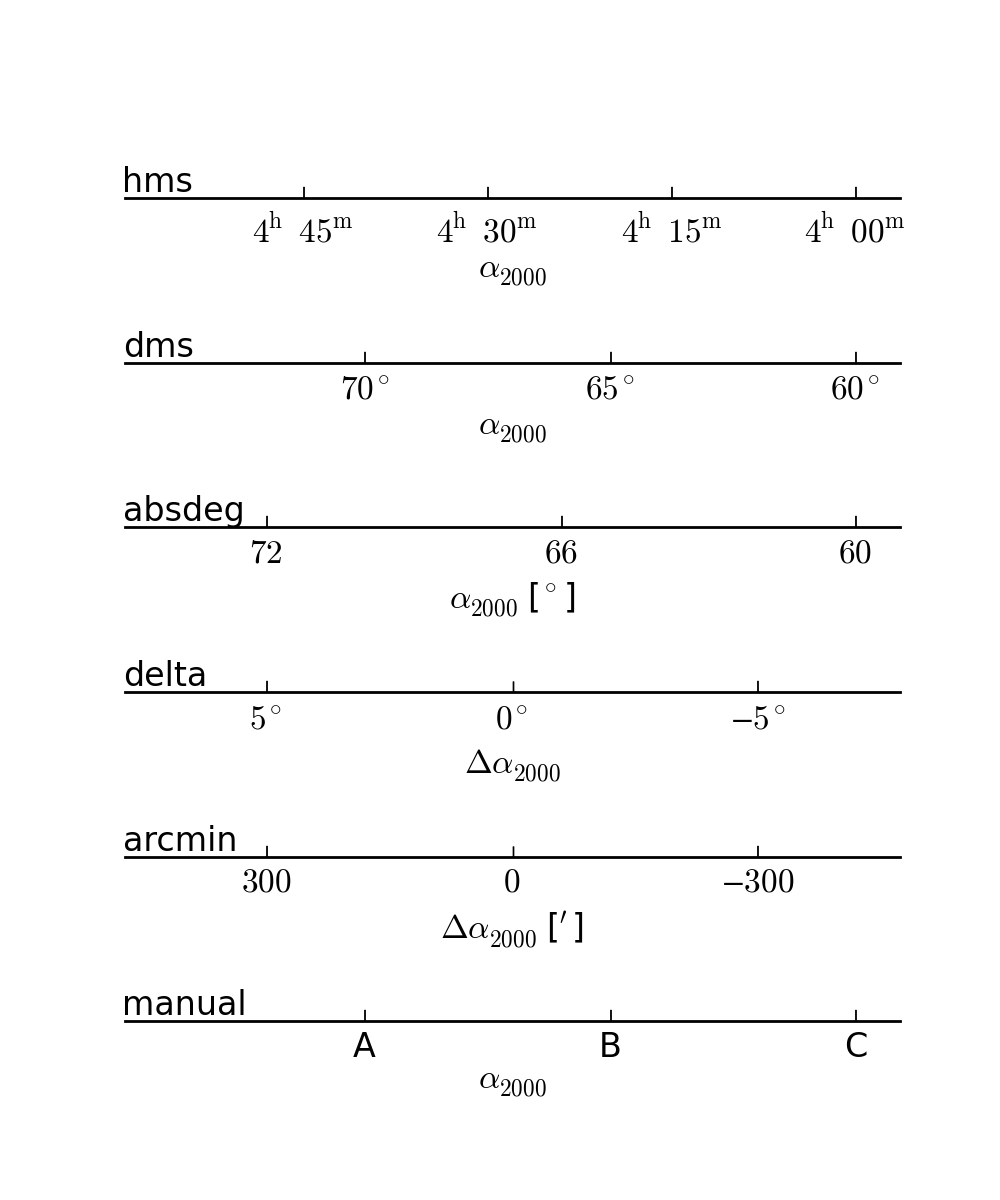
- set_ticklabel1_type(labtyp, **labtyp_kwargs)
labtyp : there are two kinds of labtyp, offset-types and non-offset-type. For offset-type labtyp, the label values are shifted from the original by the amount of the given offset. For either types, one can optionally specify the scale parameter and the scaled values (offset will be applied first if given) will be used. i.e.,
world1 = (world0 - offset) * scale
Followings are currently available labtyp.
- non-offset : absval, absdeg, hms, dms
- offset : delta, arcdeg, arcmin, arcsec
By default, the tick locations will be chosen automatically. And nbins parameter controls the approximate number of ticks. When you want your ticks at the specified location, use the locs parameter, which takes a list of tick values. However, manual ticks are not possible for labtyp of hms, dms, delta. The locs parameter will be simply ignored.
For the wcs coordinate, the default values are in the unit of degree. And for the ctype of longitude, you may specify latitude (in degree) instead of the scale.
[source code, hires.png, pdf]
- set_ticklabel2_type(labtyp, **labtyp_kwargs)
- see set_ticklabel1_type().
- set_ticklabel_type(labtyp1, labtyp2, center_pixel=None, labtyp1_kwargs=None, labtyp2_kwargs=None, **kwargs)
Set the label type of the x and y axis. Available options are
“hms” label is in H M S.S (e.g. for RA) “dms” label is in D M S.S (e.g. for DEC) “absval” label is in actual wcs value “absdeg” label is in degrees “delta” label is in offsets (arcsec, arcmin, etc) “arcdeg” label is in arcdegree offsets “arcmin” label is in arcminute offsets “arcsec” label is in arcsecond offsets If labtyp2 is None, labtyp1 is used.
For labtyp in [“delta”, “arcdeg”, “arcmin”, “arcsec”], center_pixel parameter needs to be specified, from which the offsets will be calculated.
center_pixel : in pixel coordinate (data coordinate in matplotlib)
If None, the center position of the current view-limit will be used.
labtyp1_kwargs and labtyp2_kwargs should be a dictionary of keyword arguments that are associated with labtyp1 and labtyp2. Any other keyword arguments will be associated both with labtyp1 and labtyp2. The available keywords arguments will depends on the value of labtyp1 and labtyp2. Most common options are nbins and locs. nbins specify approximate number of automatically generated ticks. locs manually specify the tick locations.
labtyp of individual axis can be set using set_ticklabel1_type() and set_ticklabel2_type() methods. See documentaion of these methods for more details.
- update_wcsgrid_params(**kwargs)
This method is deprecated. Use set_ticklabel_type or locator_params.
coord_format=(“hms”, “dms”), label_density=(4, 4),
- class pywcsgrid2.axes_wcs.AxesWcs(*kl, **kw)
Creates an axes for displaying FITS images. The axes uses the FITS header information for ticks and grids appropriate for sky coordinate.
The arguments for this axes is same as mpl’s Axes, except that either header or grid_helper (but not both) keyword arguments must be provided.
Necessary Keyword arguments:
- header: pyfits.Header instance
- header of the fits file that will be used for the axes a new pywcsgrid2.GridHelper instance is created using the header.
or:
grid_helper: pywcsgrid2.GridHelper instance
- add_beam_size(major_pixel, minor_pixel, angle, loc, frameon=False, borderpad=0.80000000000000004, patch_props=None, path_effects=None, **kwargs)
Add a ellipse patch to the axes with given sizes. This is intended to display beam size (or PSF size) of the observed image. The ellipse is located according to the loc parameter, which should be the location code as in the legend.
Keyword arguments:
major_pixel : major axis size in pixel (in the image coordinate)
minor_pixel : minor axis size in pixel
angle : angle of rotation for the ellipse
- patch_props : a dictionary of properties to be passed for
- Patch creation, e.g. facecolor, alpha, etc.
See mpl_toolkits.axes_grid1.anchored_artists for orther options.
- add_compass(loc, coord='fk5', arrow_length=0.14999999999999999, txt1='E', txt2='N', delta_a1=0, delta_a2=0, path_effects=None, **kwargs)
Add two arros with appropriate labels showing the increasing direction of the coordinate. The default label is “E” and “N”.
Keyword arguments:
arrow_length : length of the arrows in a fraction of axes size.
loc : the location code as in the legend
coord : the coordinate name. default is “fk5”
txt, txt2 : labels assocated with the arrows. Defaults are “E” & “N”
- delta_a1, delta_a2 : an optional angles (in degree) to be added to
- automatically determined directions.
- add_inner_title(title, loc, path_effects=None, **kwargs)
- Add a text at the inside corner of the axes. It simply uses mpl_toolkits.axes_grid1.anchored_artists.AnchoredText. See mpl_toolkits.axes_grid1.anchored_artists.AnchoredText for more details
- add_size_bar(length_pixel, label, loc, sep=5, borderpad=0.80000000000000004, frameon=False, path_effects=None, **kwargs)
Add a horizontal line with a label underneath. Intended to display the angular size.
Keyword arguments:
length_pixel : length of the line in pixel in the image coordinate.
label : label
loc : the location code as in the legend
- set_default_label(ticktyp1=None, ticktyp2=None)
- set x and y labels with the default values that are automatically determined according to the ticktyp and ctype of the axis.
- set_default_path_effects(path_effects)
- default_path_effects is applied to all the artists created by add-* methods. default_path_effects must be a list of path effects.
- set_display_coord_system(c)
set the coordinate system to be displayed for the axes.
- Accept:
- “fk5”|”fk4”|”gal”
- set_label_type(labtyp1, labtyp2, offset_center=None)
- set_ticklabel1_type(labtyp, **labtyp_kwargs)
Set the label type of the x axis. Available options depend on the grid_helper used. The default is GridHelperWcsBase and its variants.
See set_ticklabel1_type() for available options.
- set_ticklabel2_type(labtyp, **labtyp_kwargs)
Set the label type of the y axis. Available options depend on the grid_helper used. The default is GridHelperWcsBase and its variants.
See set_ticklabel1_type() for available options.
- set_ticklabel_type(labtyp1, labtyp2=None, center_pixel=None, labtyp1_kwargs=None, labtyp2_kwargs=None, **kwargs)
Set the label type of the x and y axes. Available options depend on the grid_helper used. The default is GridHelperWcsBase and its variants.
See set_ticklabel_type() for available options.
- swap_tick_coord()
- Swap the coordinates that will be displayed for each axis. For example, by default, x axis shows ticklabels for the first coordinate(e.g., RA) and the y axis shows the second coordinate. swap_tick_coord makes the x-axis shows the second coordinate and y-axis the second. This would be only useful when you plot highly curved coordinate system.
- update_wcsgrid_params(**ka)
This method is deprecated. Use set_ticklabel_type or locator_params.
adjust the controlling option for ticks and grid.
The option should be given as keyword arguments.
Keyword arguments:
- coord_format: a tuple of two strings describing how ticks
- are located and labeld. Currently,”hms”, “dms” are only available options. The default is (“hms”, “dms”), i.e., (hour, minute, second) for the first coordinate and (degree, minute, second) for the second coordinate. For Galactic coordinate, (“dms”, “dms”) should be more sensible. The default is (“hms”, “dms”).
- label_density: approxmate number of ticks for each coordinates.
- Currently, this is the only parameter to control the tick locations. The default is (4, 4).