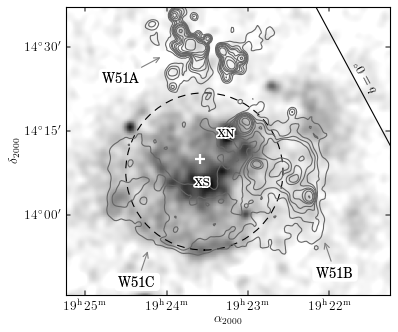
W51C X-ray and Radio
- requires the svn version of matplotlib( > 0.99.1)
- data file currently not available
import pyfits
import pyregion
import scipy.ndimage as ni
import pywcsgrid2
import matplotlib.pyplot as plt

def load_rosat():
    f = pyfits.open("xselrosat_image.xsl")
    smoothed = ni.gaussian_filter(f[0].data.astype("d"), 5)

    return f[0].header, smoothed

def load_vla():
    f = pyfits.open("w51_vgps.fits")

    return f[0].header, f[0].data


draw_contour = True

def annotate_w51c(ax, header):
    # draw + to mark center
    reg = pyregion.open("remnant_center.reg")
    cx, cy = reg[0].coord_list[:2]
    print cx, cy
    ax["fk5"].plot([290.896], [14.1669], "w+", ms=9, mew=2, zorder=3)

    # draw b=0 line
    axis = ax["gal"].new_floating_axis(1, 0.)
    axis.toggle(all=False, label=True)
    axis.label.set_text(r"$b=0^{\circ}$")
    ax.axis["b=0"] = axis


    # draw XMM Mos region
    reg = pyregion.open("mos_fov.reg").as_imagecoord(header)
    patches, txts = reg.get_mpl_patches_texts()
    circ = patches[0]
    ax.add_patch(circ)


    # Mark W51C, W51A, W51B
    kwargs = dict(arrowprops=dict(arrowstyle="->", ec=".5",
                                  relpos=(0.5, 0.5)),
                  bbox=dict(boxstyle="round", ec="none", fc="w"))

    ann1 = ax.annotate("W51C", xy=(481, 415),
                       xytext=(-10, -25), textcoords="offset points",
                       ha="center", va="top", **kwargs)

    ann1 = ax.annotate("W51B", xy=(732, 428),
                       xytext=(10, -25), textcoords="offset points",
                       ha="center", va="top", **kwargs)

    ann1 = ax.annotate("W51A", xy=(501, 691),
                       xytext=(-20, -15), textcoords="offset points",
                       ha="right", va="top", **kwargs)


    # annotate XN and XS
    from matplotlib.patheffects import withStroke
    myeffect = withStroke(foreground="w", linewidth=3)
    kwargs = dict(path_effects=[myeffect])

    t1 = ax.annotate("XN", (592, 581), size=10,
                     ha="center", va="center",
                     **kwargs)
    t2 = ax.annotate("XS", (558, 511), size=10,
                     ha="center", va="center",
                     **kwargs)


def draw_radio_contour(ax):
    vla_header, vla_im = load_vla()
    cont = ax[vla_header].contour(vla_im,
                                  [40, 60, 80, 100, 150, 200,
                                   300, 500, 1000], colors="w")
    [cl.set_color("0.4") for cl in cont.collections]


if 1:

    fig = plt.figure(1)
    fig.clf()

    header, rosat_im = load_rosat()

    ax = pywcsgrid2.subplot(111, header=header)
    im = ax.imshow(rosat_im, origin="lower", cmap=plt.cm.gray_r)
    im.set_clim(0.11, 0.7)


    annotate_w51c(ax, header)

    draw_radio_contour(ax)

    ax.set_xlim(363, 827)
    ax.set_ylim(349, 761)

    plt.show()

    if 0:
        fig.savefig("w51_rosat.eps", bbox_inches="tight")

    ## (b)
[source code, hires.png, pdf]