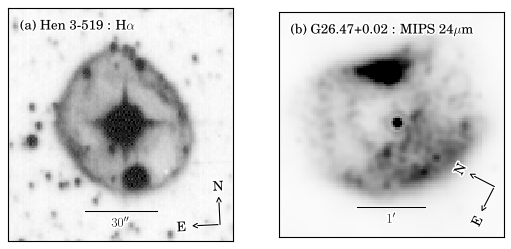
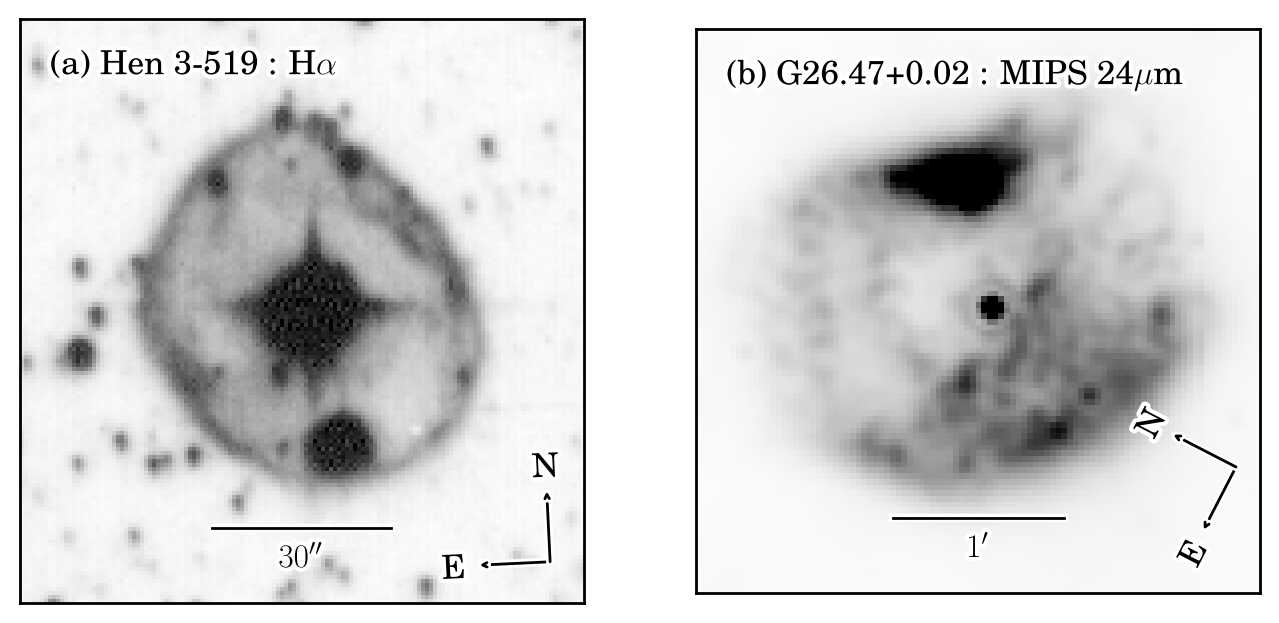
Ha and MIPS 24um of LBVs
- requires matplotlib > 1.0
- data file currently not available
import matplotlib.pyplot as plt
from matplotlib.patheffects import withStroke

import pywcsgrid2
import pyfits


f = pyfits.open("Hen_3-519.Ha.fits")

fig = plt.figure(figsize=(8,4))
ax = pywcsgrid2.subplot(121, wcs=f[0].header)
ax.set_default_path_effects([withStroke(foreground="w", linewidth=3)])

im = ax.imshow(f[0].data, origin="lower", cmap="gray_r")
im.set_clim(2941, 15000)

ax.set(xlim=(149.5, 290.5),
       ylim=(149.5, 295.5))

ax.axis[:].toggle(all=False)
it = ax.add_inner_title(r"(a) Hen 3-519 : H$\alpha$", loc=2)
it.patch.set_ec("none")

pixels_of_30_arcmin = 0.5/60./f[0].header["CD2_2"]
ax.add_size_bar(pixels_of_30_arcmin, r"$30^{\prime\prime}$", loc=8)
ax.add_compass(loc=4)


f2 = pyfits.open("G26.47+0.02.24um.fits")

ax2 = pywcsgrid2.subplot(122, wcs=f2[0].header)
ax2.set_default_path_effects([withStroke(foreground="w", linewidth=3)])


ax2.axis[:].toggle(all=False)
it2 = ax2.add_inner_title(r"(b) G26.47+0.02 : MIPS 24$\mu$m", loc=2)
it2.patch.set_ec("none")
pixels_of_30_arcmin = 1./60./f2[0].header["CDELT2"]
ax2.add_size_bar(pixels_of_30_arcmin, r"$1^{\prime}$", loc=8)

im2 = ax2.imshow(f2[0].data, origin="lower", cmap="gray_r")

im2.set_clim(41, 600)

ax2.set(ylim=(101.5, 200.5),
        xlim=(97.5, 196.5))

ax2.add_compass(loc=4)

plt.show()
[source code, hires.png, pdf]