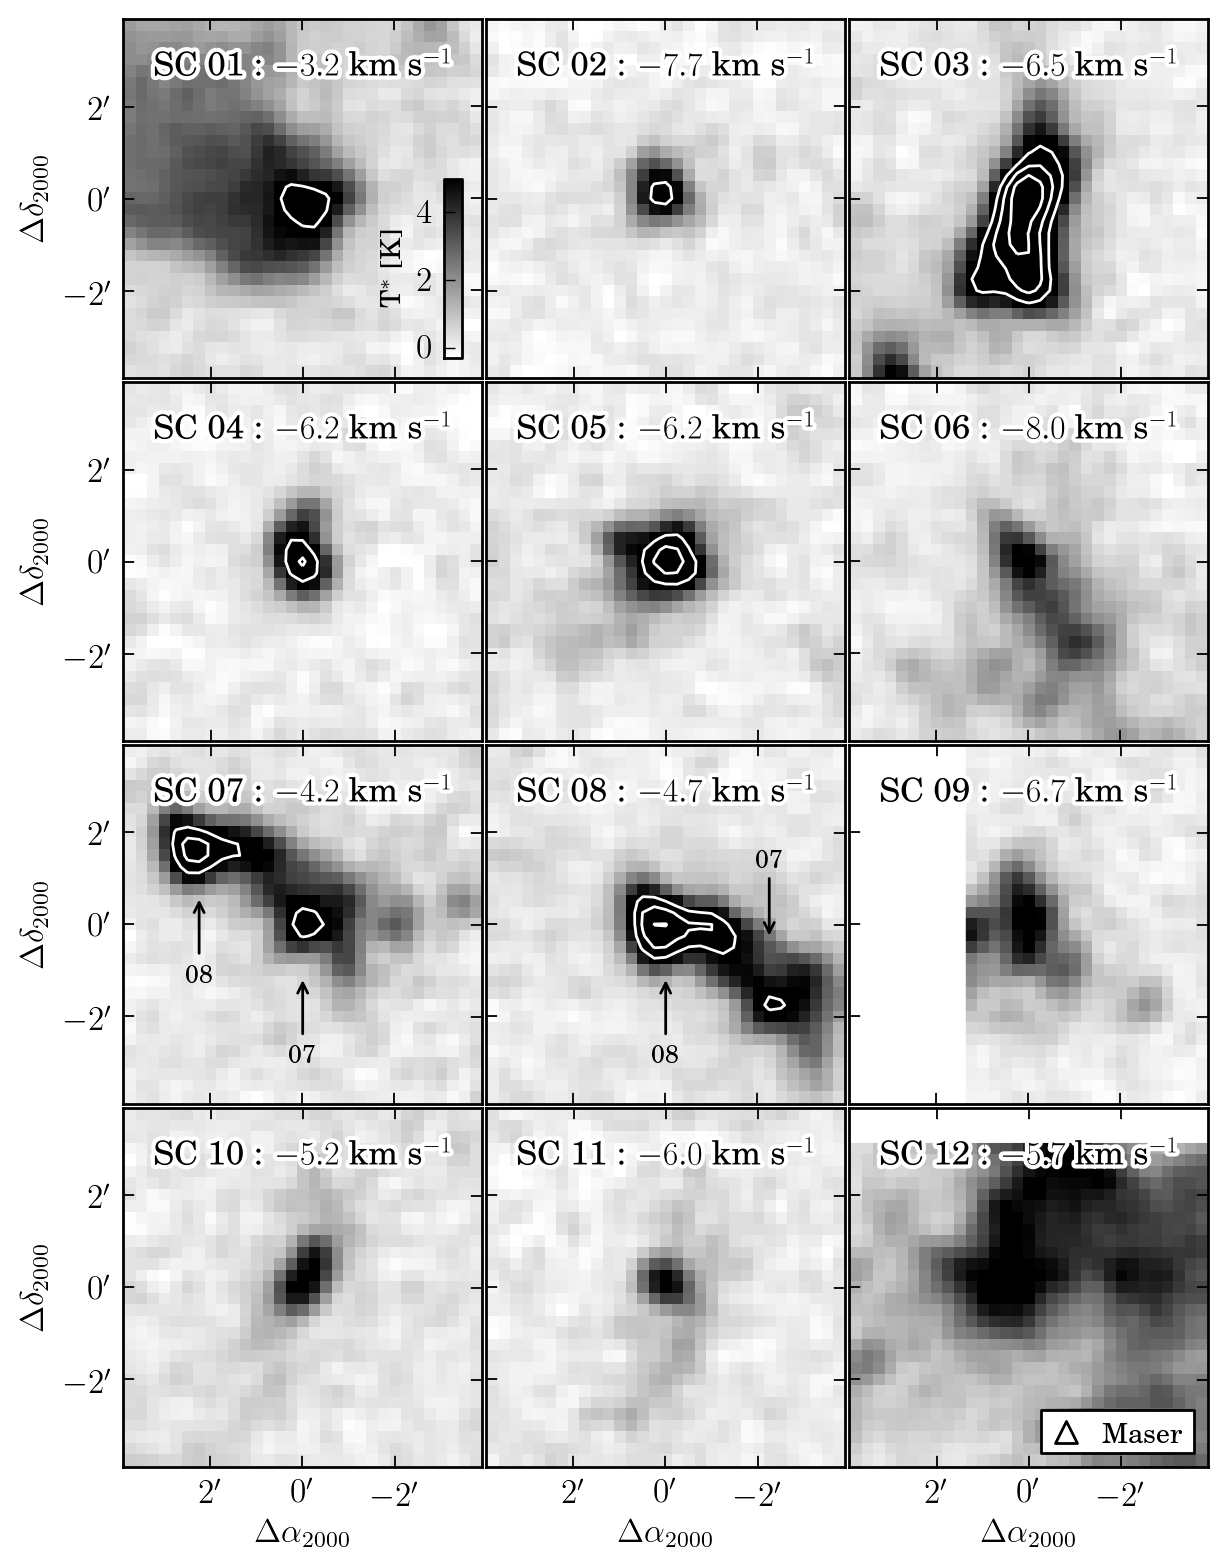
IC443 CO Stamps
- requires matplotlib > 0.99.1
- data file currently not available
- The x-coordinates and y-coordinates are in arcminutes from reference points. For each panel, a parasite axes for the original image coordinate.
import jjpy.cube as cube
import pyfits
import pywcs

import mpl_toolkits.axes_grid1 as axes_grid
from mpl_toolkits.axes_grid1 import anchored_artists

import matplotlib.pyplot as plt
import pywcsgrid2

def setup_axes(fig, imx_c, imy_c, h):

    grid = axes_grid.Grid(fig, "111",
                          nrows_ncols=(4, 3), #ngrids=11,
                          direction='row', axes_pad=0.02,
                          add_all=True,
                          share_all=False, #False,
                          share_x=False, share_y=False,
                          label_mode='L',
                          axes_class=(pywcsgrid2.Axes, {"header":h}))
    grid.set_aspect(True)


    # colorbar axes
    from mpl_toolkits.axes_grid.inset_locator import inset_axes
    axins = inset_axes(grid[0],
                       width="5%",
                       height="50%",
                       loc=4,
                       )

    axins.axis[:].toggle(all=False)
    axins.axis["left"].toggle(all=True)
    axins.axis["left"].label.set_size(10)

    return grid, axins


if 1:

    c = pyfits.open("ic443_coN.raw.reorder.han-ind.contsub1.fits")
    wcs = pywcs.WCS(c[0].header).sub([1, 2])
    cube = cube.Cube(c[0].data, c[0].header)

    imx_c = [ 212.,  162.,  148.,  152., 93.,   57.  ,   57.,   48.,
              5.,   75. ,   75.,  114.]

    imy_c = [ 202.,  168.,  132.,   78., 78.,   98.,  126.,  133.,
              163.,  148.,  155.,  234.]

    peak_channel_list = [79, 97, 92, 91, 91, 98, 83, 85, 93, 87, 90, 89]

    cdelt_arcmin = abs(c[0].header["cdelt1"])*60.


    fig = plt.figure(1, figsize=(7., 10))

    grid, axins = setup_axes(fig, imx_c, imy_c, c[0].header)

#     def get_translated_coord(i, x, y):
#         return (x - imx_c[i])*cdelt_arcmin, (y - imy_c[i])*cdelt_arcmin

    mynorm=plt.Normalize()

    ny, nx = cube.data.shape[-2:]

    for i, ax in enumerate(grid):
        imx, imy, pc = imx_c[i], imy_c[i], peak_channel_list[i]
        chan = cube.channel(pc)
        ax.imshow(chan.data, origin="lower",
                  interpolation="nearest",
                  cmap=plt.cm.gray_r,
                  norm=mynorm,
                  )

        ax.contour(chan.data, [6, 8, 10],
                   colors="w")


    if 1: # mark maser
        """ VLA C-array :  12\arcsec
        06 17 29.3  +22 22 43
        06 18 03.7  +22 24 53
        """
        import coords
        p_list = [coords.Position("06:17:29.3  +22:22:43").j2000(),
                  coords.Position("06:18:03.7  +22:24:53").j2000(),
                  (94.181357,22.543208)]
        for p1, ax in zip(p_list, [grid[4], grid[5], grid[2]]):
            ra, dec = p1
            l1, = ax[wcs].plot([ra], [dec],
                               "^", mec="k", mfc="w", mew=1, ms=8,
                               zorder=3.1)

        grid[-1].legend([l1], ["Maser"], loc=4, numpoints=1, handlelength=1,
                        prop=dict(size=10))


    dx_arcmin, dy_arcmin = 3.9, 3.9 # 4'
    dx_pixel = dx_arcmin/cdelt_arcmin
    dy_pixel = dy_arcmin/cdelt_arcmin

    for ax, imx, imy in zip(grid, imx_c, imy_c):
        ax.set_xlim(imx-dx_pixel, imx+dx_pixel)
        ax.set_ylim(imy-dy_pixel, imy+dy_pixel)
        ax.set_ticklabel_type("delta")
        #ax.set_ticklabel_type("arcmin", locs=[-2,  0,  2])

    mynorm.vmin=-0.3
    mynorm.vmax=5

    # add labels
    from itertools import count, izip
    try:
        from matplotlib.patheffects import withStroke
    except ImportError:
        withStroke = None

    for i, ax, pc in izip(count(1), grid, peak_channel_list):
        v = cube.ax.imz2skyz(pc)/1000.
        txt = anchored_artists.AnchoredText("SC %02d : $%4.1f$ km s$^{-1}$" % (i, v),
                                            loc=2,
                                            frameon=False,
                                            prop=dict(size=12))
        if withStroke:
            txt.txt._text.set_path_effects([withStroke(foreground="w",
                                                       linewidth=3)])
        ax.add_artist(txt)


    if 1: # colorbar
        cb = plt.colorbar(grid[0].images[0], cax = axins)
        cb.set_ticks([0, 2, 4])
        axins.axis["right"].toggle(all=False)
        axins.axis["left"].toggle(all=True)
        cb.set_label("T$^*$ [K]")


    #grid.axes_llc.set_xlabel(r"$\Delta$ R.A. [$^{\prime}$]")
    #grid.axes_llc.set_ylabel(r"$\Delta$ Dec. [$^{\prime}$]")


    # annotate plot SC 7
    a1 = grid[6].annotate("07", (imx_c[6], imy_c[6]),
                          xytext=(imx_c[6], imy_c[6]-12),
                          size=9, ha="center",
                          arrowprops=dict(arrowstyle="->",
                                          shrinkB=20,
                                          ))
    a1 = grid[6].annotate("08", (imx_c[7], imy_c[7]),
                          xytext=(imx_c[7], imy_c[7]-12),
                          size=9, ha="center",
                          arrowprops=dict(arrowstyle="->",
                                          shrinkB=20,
                                          ))

    # annotate plot 8
    a1 = grid[7].annotate("07", (imx_c[6], imy_c[6]),
                          xytext=(imx_c[6], imy_c[6]+12),
                          size=9, ha="center",
                          arrowprops=dict(arrowstyle="->",
                                          shrinkB=25,
                                              ))
    a1 = grid[7].annotate("08", (imx_c[7], imy_c[7]),
                          xytext=(imx_c[7], imy_c[7]-12),
                          size=9, ha="center",
                          arrowprops=dict(arrowstyle="->",
                                          shrinkB=20,
                                          ))


    plt.show()
[source code, hires.png, pdf]
