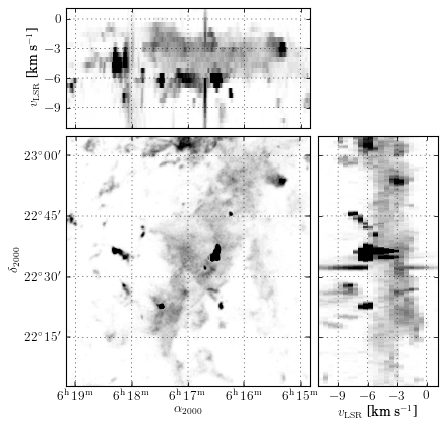
IC443 CO Position-Velocity Map
- requires svn version of matplotlib or future release (>0.99.1)
- data file currently not available
import pywcsgrid2
import pyfits

import mpl_toolkits.axisartist as axisartist

import matplotlib.pyplot as plt

def setup_axes(fig, header):
    from mpl_toolkits.axes_grid import make_axes_locatable

    ax0 = pywcsgrid2.subplot(111, wcs=header)
    divider = make_axes_locatable(ax0)

    gh1 = pywcsgrid2.GridHelperSimple(wcs=header, axis_nums=[0, 2])
    ax_v = divider.new_vertical(1.5, pad=0.1, sharex=ax0,
                                axes_class=pywcsgrid2.Axes,
                                grid_helper=gh1)
    fig.add_axes(ax_v)

    gh2 = pywcsgrid2.GridHelperSimple(wcs=header, axis_nums=[2, 1])
    ax_h = divider.new_horizontal(1.5, pad=0.1, sharey=ax0,
                                axes_class=pywcsgrid2.Axes,
                                grid_helper=gh2)

    fig.add_axes(ax_h)


    ax_h.axis["left"].toggle(label=False, ticklabels=False)
    ax_v.axis["bottom"].toggle(label=False, ticklabels=False)


    return ax0, ax_v, ax_h


fits_cube = pyfits.open("ic443_co.ambient.fits")
header = fits_cube[0].header


import matplotlib.colors as mcolors
norm = mcolors.Normalize()
cmap = plt.cm.gray_r

fits_cube[0].data = fits_cube[0].data**2

vv0  = fits_cube[0].data.max(axis=0)
vv1  = fits_cube[0].data.max(axis=1)
vv2  = fits_cube[0].data.max(axis=2).transpose()


fig = plt.figure(1, figsize=(6, 6))
ax0, ax_v, ax_h = setup_axes(fig, header)

im0 = ax0.imshow(vv0, origin="lower", interpolation="nearest",
                 norm=norm, cmap=cmap)

ax_v.imshow(vv1, origin="lower", aspect="auto",
            interpolation="nearest", norm=norm, cmap=cmap)


ax_h.imshow(vv2, origin="lower", aspect="auto",
            interpolation="nearest", norm=norm,
            cmap=cmap)

ax0.grid(True)
ax_h.grid(True)
ax_v.grid(True)

norm.vmin=0.1
norm.vmax=5**2
for ax in [ax0, ax_h, ax_v]:
    ax.images[0].changed()

gh1 = ax_v.get_grid_helper()
gh1.set_ticklabel2_type("absval", scale=0.001, nbins=5)

gh2 = ax_h.get_grid_helper()
gh2.set_ticklabel1_type("absval", scale=0.001, nbins=5)

ax_h.axis["bottom"].label.set_text(r"$v_{\mathrm{LSR}}$ [km s$^{-1}$]")
ax_v.axis["left"].label.set_text(r"$v_{\mathrm{LSR}}$ [km s$^{-1}$]")


plt.show()
[source code, hires.png, pdf]