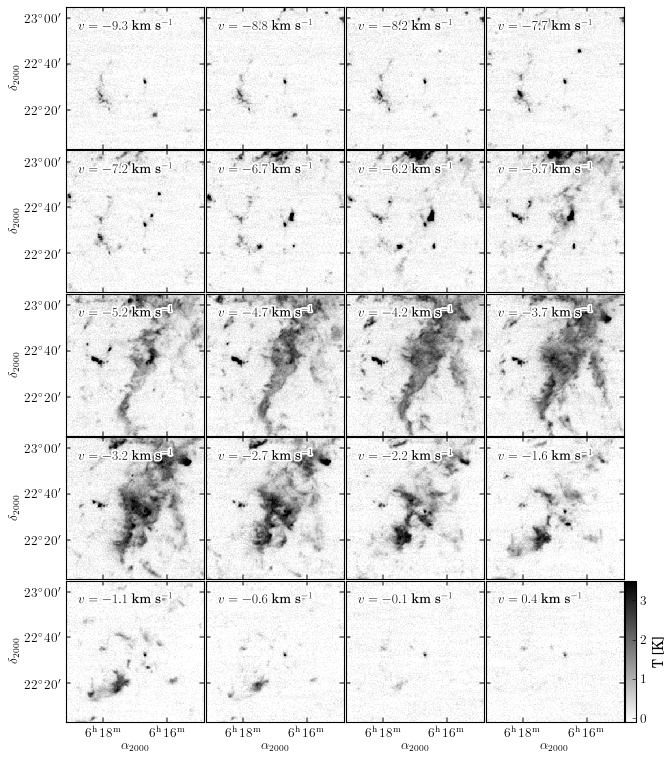
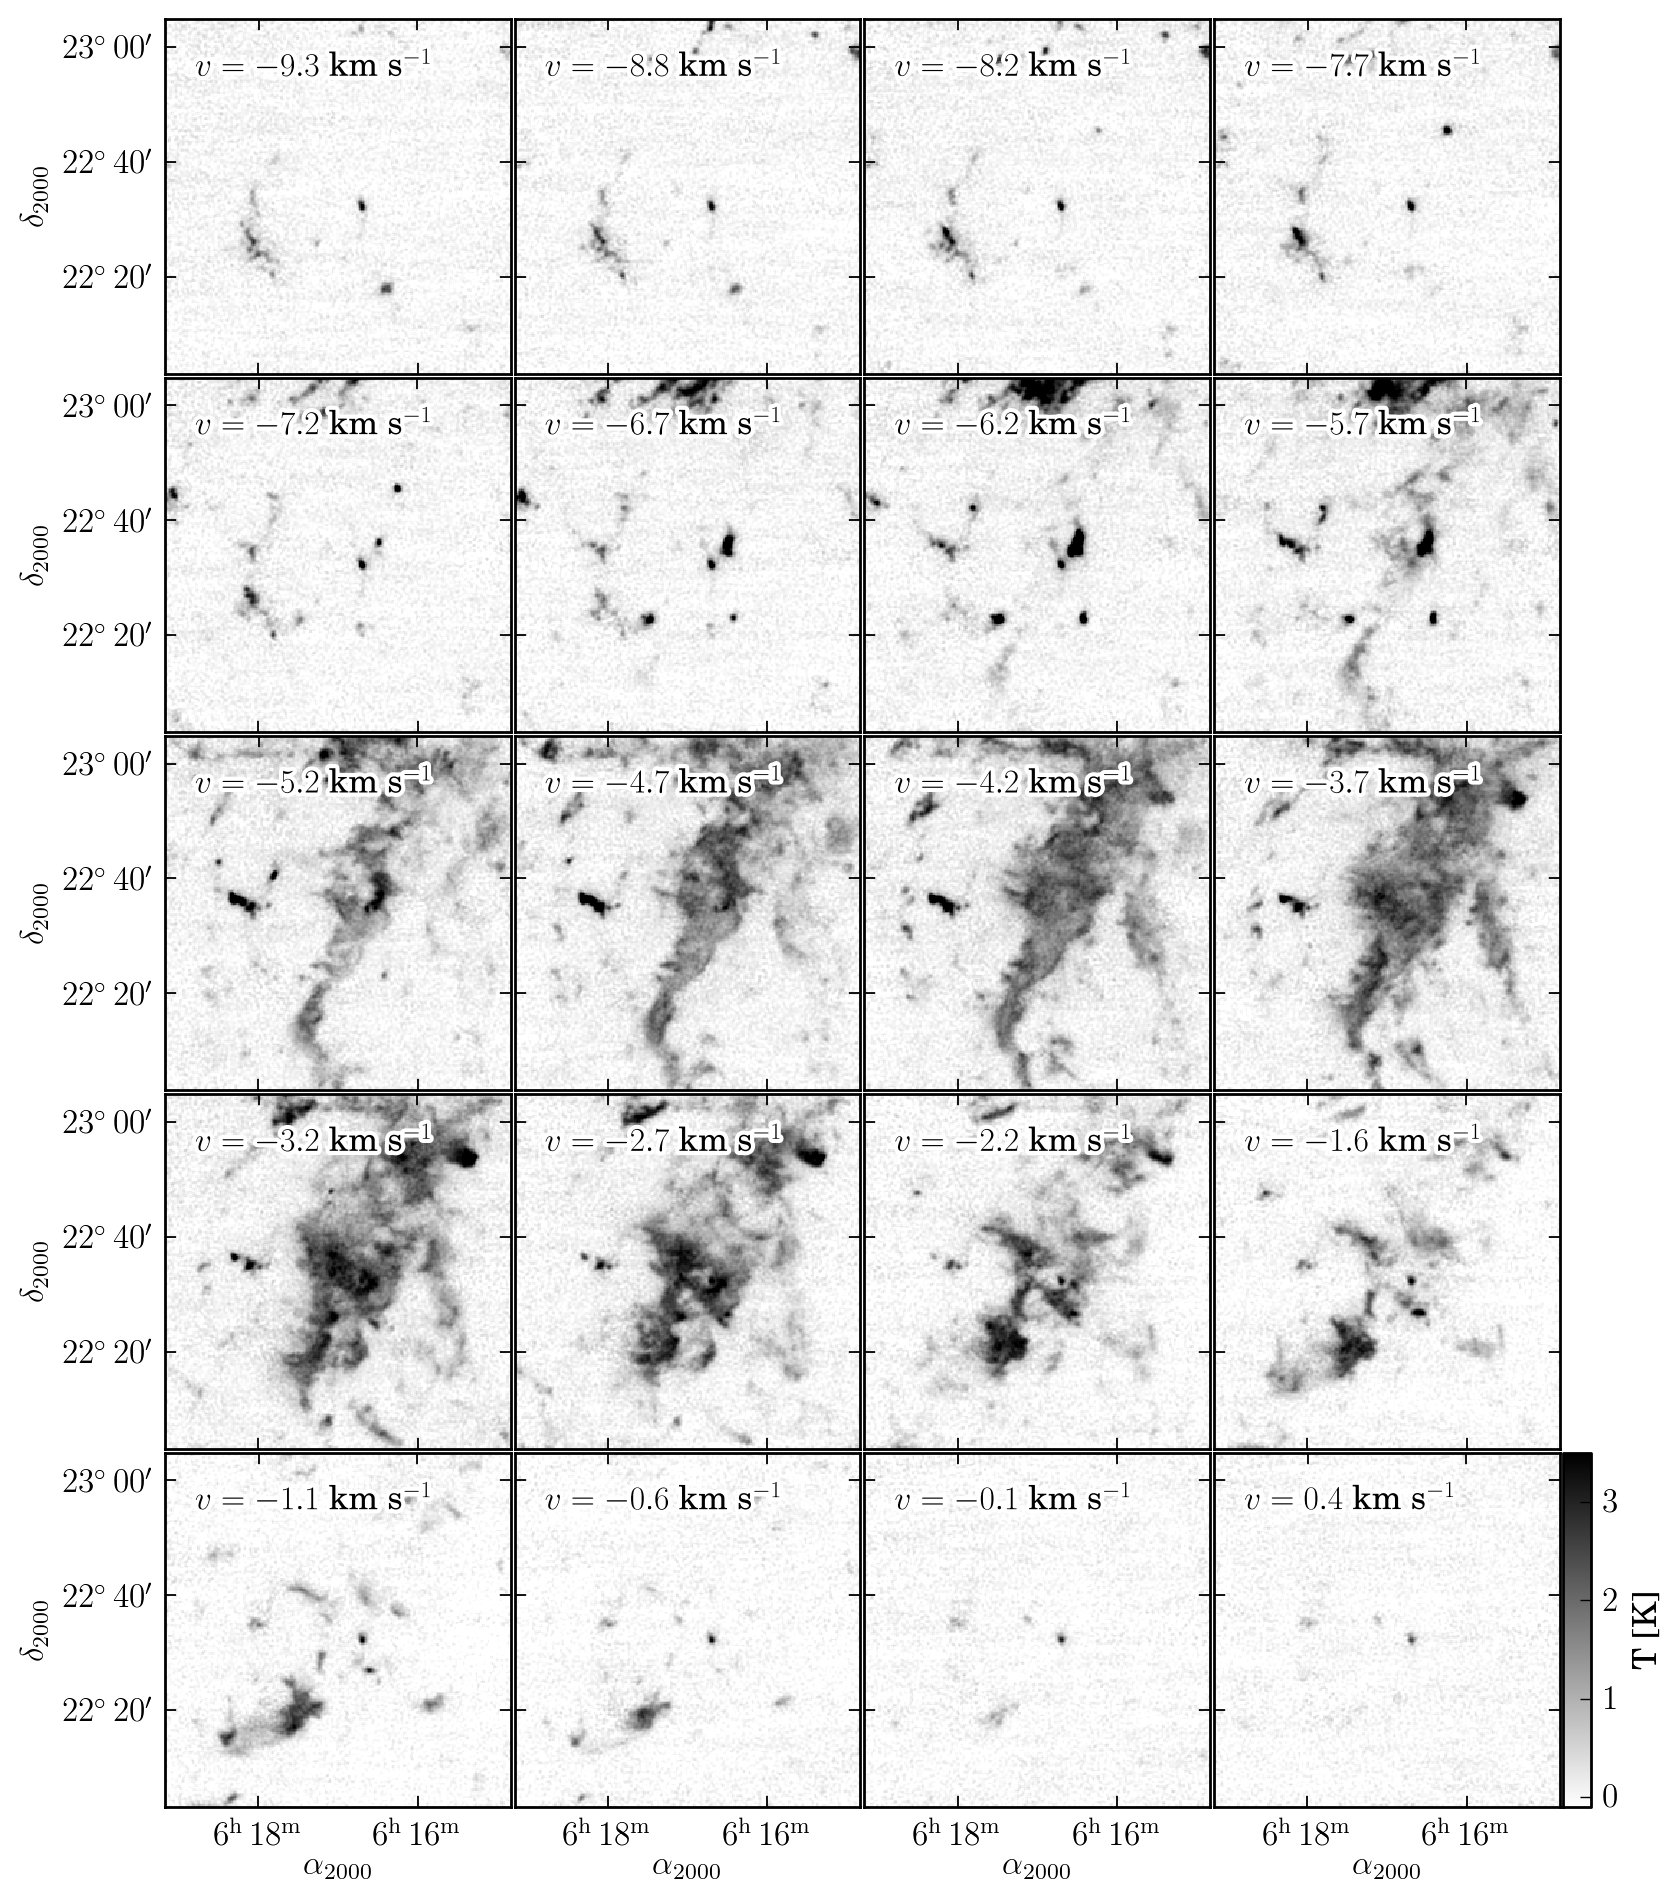
IC443 CO Channel Maps
- requires svn version of matplotlib or future release (>0.99.1)
- data file currently not available
import matplotlib.pyplot as plt
import pywcsgrid2
import pywcs

import mpl_toolkits.axes_grid1.axes_grid as axes_grid
#from mpl_toolkits.axes_grid.colorbar import colorbar
from mpl_toolkits.axes_grid1.inset_locator import inset_axes

import pyfits

class Velo(object):
    def __init__(self, header):
        wcs = pywcs.WCS(header)
        self.wcs_vel = wcs.sub([3])

    def to_vel(self, p):
        v = self.wcs_vel.wcs_pix2sky([[p]], 0)
        return v[0][0]


def setup_axes(fig, header):

    gh = pywcsgrid2.GridHelper(wcs=header)
    gh.locator_params(nbins=3)

    g = axes_grid.ImageGrid(fig, 111,
                            nrows_ncols=(5, 4),
                            ngrids=None,
                            direction='row',
                            axes_pad=0.02, add_all=True,
                            share_all=True, aspect=True,
                            label_mode='L', cbar_mode=None,
                            axes_class=(pywcsgrid2.Axes, dict(grid_helper=gh)))

    # make colorbar
    ax = g[-1]
    cax = inset_axes(ax,
                     width="8%", # width = 10% of parent_bbox width
                     height="100%", # height : 50%
                     loc=3,
                     bbox_to_anchor=(1.01, 0, 1, 1),
                     bbox_transform=ax.transAxes,
                     borderpad=0.
                     )

    return g, cax


fits_cube = pyfits.open("ic443_co.ambient.fits")
header = fits_cube[0].header

vel = Velo(header)

fig = plt.figure(1, figsize=(9, 12), dpi=70)
g, cax = setup_axes(fig, header)

# draw images

i = 0
dxy = 3
nxy = 5 * 4
cmap = plt.cm.gray_r
import matplotlib.colors as mcolors
norm = mcolors.Normalize()
images = []
start_channel = i*nxy+dxy
for i, ax in enumerate(g):
    channel_number = start_channel + i
    channel = fits_cube[0].data[channel_number]
    im = ax.imshow(channel, origin="lower", norm=norm, cmap=cmap)
    images.append(im)


# label with velocities
use_path_effect = True
try:
    from matplotlib.patheffects import withStroke
except ImportError:
    use_path_effect = False

for i, ax in enumerate(g):
    channel_number = start_channel + i
    v = vel.to_vel(channel_number) / 1.e3
    t = ax.add_inner_title(r"$v=%4.1f$ km s$^{-1}$" % (v), loc=2, frameon=False)
    if use_path_effect:
        t.txt._text.set_path_effects([withStroke(foreground="w",
                                                 linewidth=3)])


# make colorbar
cb = plt.colorbar(im, cax=cax)
cb.set_label("T [K]")
cb.set_ticks([0, 1, 2, 3])

# adjust norm
norm.vmin = -0.1
norm.vmax = 3.5
for im in images:
    im.changed()

plt.show()

if 0:
    plt.savefig("co_channel_maps.eps", dpi=70, bbox_inches="tight")
[source code, hires.png, pdf]