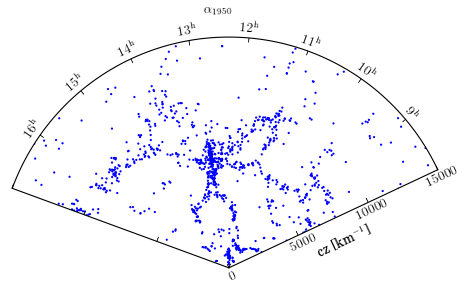
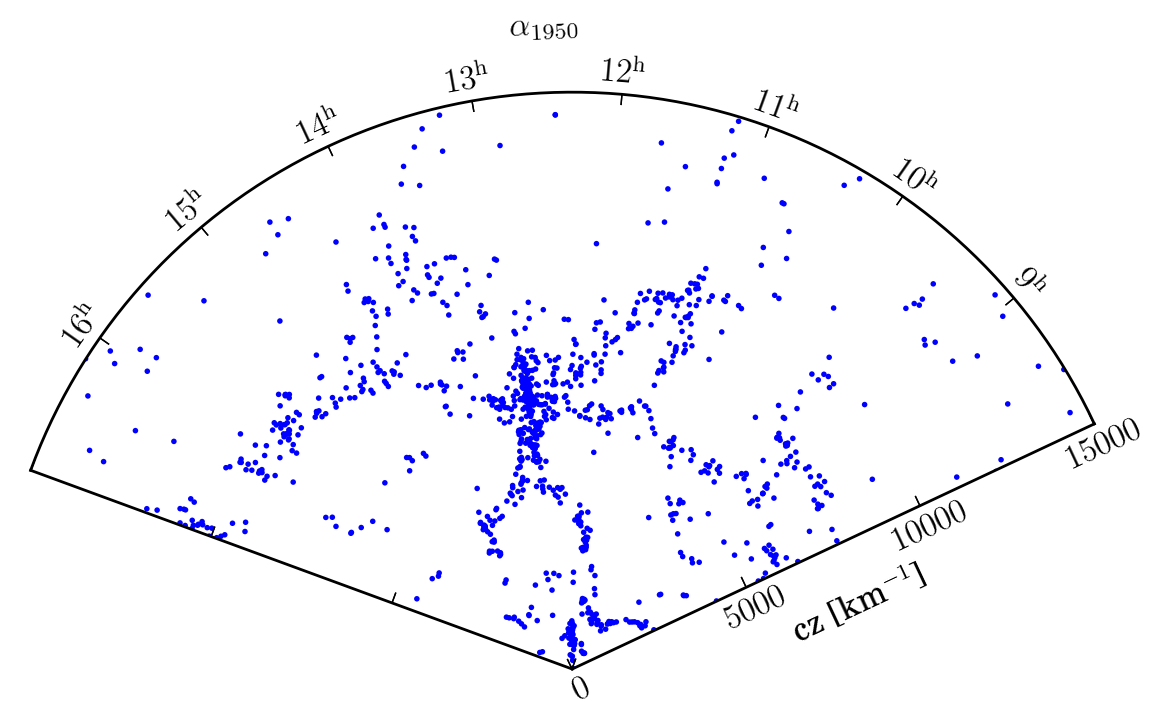
CfA Survey
- requires svn version of matplotlib or future release (>0.99.1)
- FortranFormat.py (from ScientifiPython)
- data file from http://www.cfa.harvard.edu/~huchra/zcat/
from matplotlib.transforms import Affine2D

from mpl_toolkits.axisartist.floating_axes import FloatingSubplot,\
     GridHelperCurveLinear

import numpy as np
import  mpl_toolkits.axisartist.angle_helper as angle_helper
from matplotlib.projections import PolarAxes

def setup_axes(fig):

    # rotate a bit for better orientation
    tr_rotate = Affine2D().translate(-95, 0)

    # scale degree to radians
    tr_scale = Affine2D().scale(np.pi/180., 1.)

    tr = tr_rotate + tr_scale + PolarAxes.PolarTransform()

    grid_locator1 = angle_helper.LocatorHMS(8)
    tick_formatter1 = angle_helper.FormatterHMS()

    #from mpl_toolkits.axes_grid.grid_finder import FixedLocator
    #grid_locator2 = FixedLocator([0., 5000, 10000, 15000])

    from mpl_toolkits.axisartist.grid_finder import MaxNLocator
    grid_locator2 = MaxNLocator(3)

    ra0, ra1 = 8.01*15, 16.99*15
    cz0, cz1 = 0, 15000
    grid_helper = GridHelperCurveLinear(tr,
                                        extremes=(ra1, ra0, cz1, cz0),
                                        grid_locator1=grid_locator1,
                                        grid_locator2=grid_locator2,
                                        tick_formatter1=tick_formatter1,
                                        tick_formatter2=None,
                                        )

    ax1 = FloatingSubplot(fig, 111, grid_helper=grid_helper)
    fig.add_subplot(ax1)

    # adjust axis
    ax1.axis["left"].toggle(ticklabels=False)
    ax1.axis["right"].toggle(ticklabels=True)
    ax1.axis["right"].set_axis_direction("bottom")
    ax1.axis["right"].label.set_visible(True)
    #ax1.axis["right"].major_ticklabels.set_pad(5) #label.set_visible(True)

    ax1.axis["bottom"].major_ticklabels.set_axis_direction("top")
    ax1.axis["bottom"].label.set_axis_direction("top")

    ax1.axis["top"].set_visible(False)

    ax1.axis["right"].label.set_text(r"cz [km$^{-1}$]")
    ax1.axis["bottom"].label.set_text(r"$\alpha_{1950}$")

    #ax1.axis["right"].set_visible(False)
    #ax1.axis["bottom"].set_visible(False)
    #ax1.axis["left"].set_visible(False)

    # create a parasite axes whose transData in RA, cz
    aux_ax = ax1.get_aux_axes(tr)

    aux_ax.patch = ax1.patch # for aux_ax to have a clip path as in ax
    ax1.patch.zorder=0.9 # but this has a side effect that the patch is
                        # drawn twice, and possibly over some other
                        # artists. So, we decrease the zorder a bit to
                        # prevent this.

    return ax1, aux_ax


def sixty(d, m, s):
    return d + (m + s/60.)/60.


def load_data():
    """
    read in data
    """
    import FortranFormat as FF

    ll = open("n30.dat").readlines()
    lll = ll[29:-8] #[-10:]
    format = FF.FortranFormat("A11,I2,I2,F4.1,A1,I2,I2,I2,F5.2,I5")

    alphas, deltas, mags, czs = [], [], [], []

    for l in lll:
        line = FF.FortranLine(l, format)

        alpha = sixty(line[1], line[2], line[3]) * 15.# alpha
        sgn = {"-":-1}.get(line[4], 1)
        delta = sgn*sixty(line[5], line[6], line[7]) # delta
        mag = line[8]
        cz = line[9]

        alphas.append(alpha)
        deltas.append(delta)
        mags.append(mag)
        czs.append(cz)

    alphas = np.array(alphas)
    deltas = np.array(deltas)
    mags = np.array(mags)
    czs = np.array(czs)

    return alphas, czs

if 1:

    alphas, czs = load_data()

    import matplotlib.pyplot as plt
    fig = plt.figure(1, figsize=(7, 5))
    fig.clf()
    ax, aux_ax = setup_axes(fig)

    sct = aux_ax.scatter(alphas, czs, s=4, edgecolors="none")

    plt.show()
[source code, hires.png, pdf]