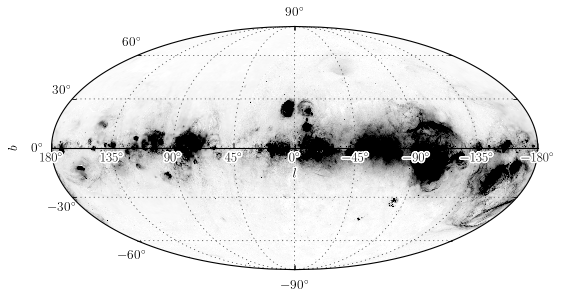
All-Sky Plot : WHAM
- FIXME : incorrect tick direction at the coordinate boundary
- requires svn version of matplotlib or future release (>0.99.1)
- data file (optional) from here
import matplotlib.pyplot as plt
import pyfits

import matplotlib.patheffects


if 1:

    fits_name = "lambda_mollweide_halpha_fwhm06_0512.fits"
    f = pyfits.open(fits_name)
    data = f[1].data
    header = f[1].header

    # used fixed header
    del header["LONPOLE"]
    del header["LATPOLE"]

    fig = plt.figure(1, figsize=(8, 5))
    fig.clf()

    from pywcsgrid2.allsky_axes import make_allsky_axes_from_header

    ax = make_allsky_axes_from_header(fig, rect=111, header=header,
                                      lon_center=0.)

    if data is not None:
        im = ax.imshow(data, origin="lower", cmap=plt.cm.gray_r)
        im.set_clip_path(ax.patch)
        im.set_clim(0, 30)

    ef = matplotlib.patheffects.withStroke(foreground="w", linewidth=3)
    axis = ax.axis["lat=0"]
    axis.major_ticklabels.set_path_effects([ef])
    axis.label.set_path_effects([ef])
    axis.set_zorder(5)

    ax.grid()
    plt.show()
[source code, hires.png, pdf]
