Publication quality figures w/ Matplotlib

Presenter Notes
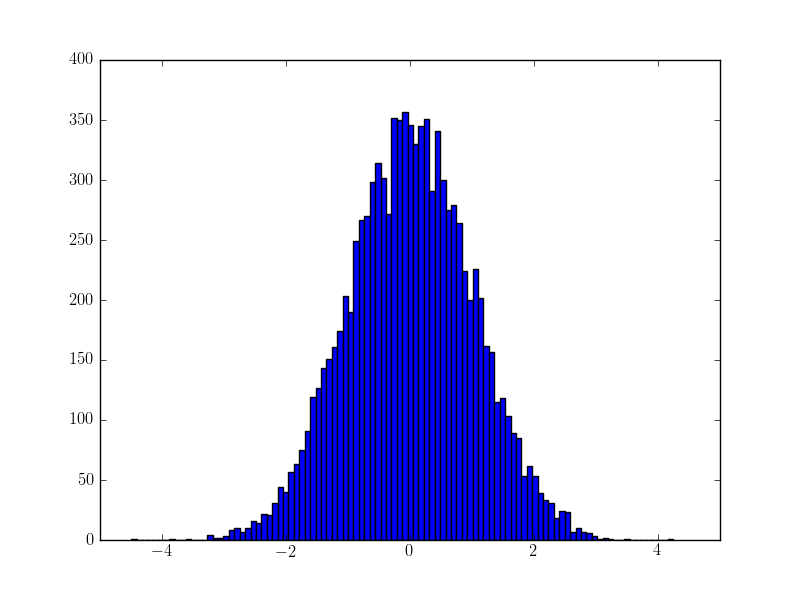
x = randn(10000)
hist(x, 100)
Presenter Notes

Presenter Notes

Presenter Notes

Presenter Notes

Presenter Notes

Presenter Notes

Presenter Notes

Presenter Notes
RTFM
Read The Fine Manual

Presenter Notes
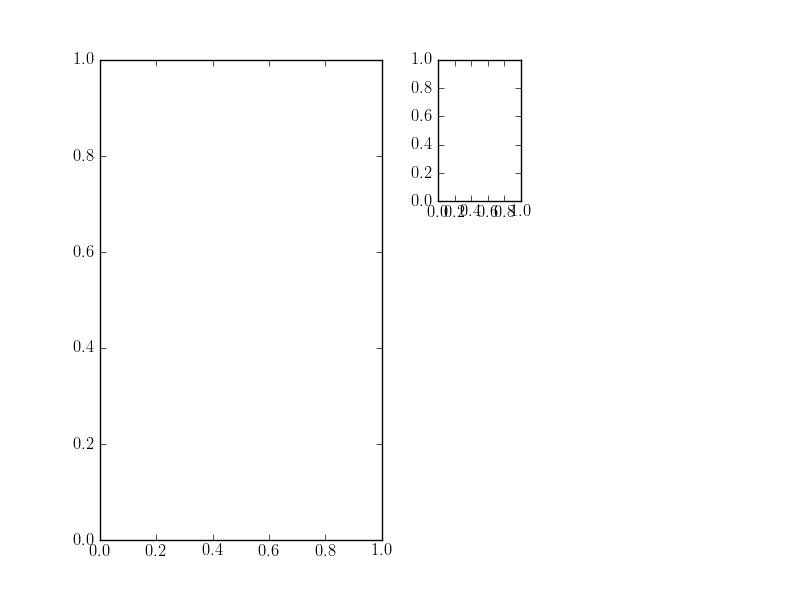
GridSpec : advanced subplot
See http://matplotlib.sourceforge.net/users/gridspec.html
import matplotlib.gridspec as gridspec

gs = gridspec.GridSpec(3, 3)

ax1 = plt.subplot(gs[0, :])
ax2 = plt.subplot(gs[1,:-1])
ax3 = plt.subplot(gs[1:, -1])
ax4 = plt.subplot(gs[-1,0])
ax5 = plt.subplot(gs[-1,-2])

Presenter Notes
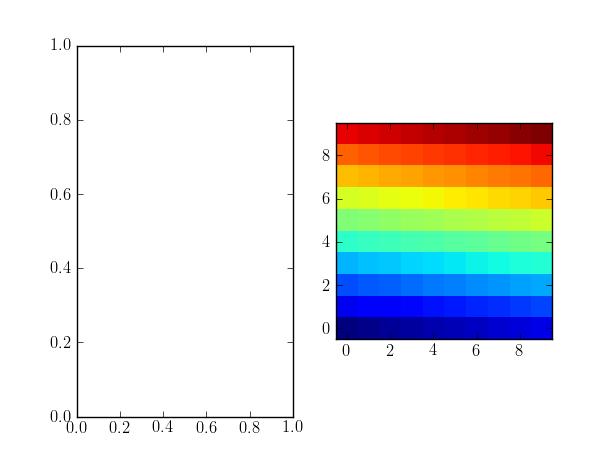
Embedded subplots
from matplotlib.gridspec import GridSpec, GridSpecFromSubplotSpec

gs = GridSpec(1,2)
ax1 = plt.subplot(gs[0])

gs1 = GridSpecFromSubplotSpec(3, 3, subplot_spec=gs[1])
ax2 = plt.subplot(gs1[0])
Presenter Notes
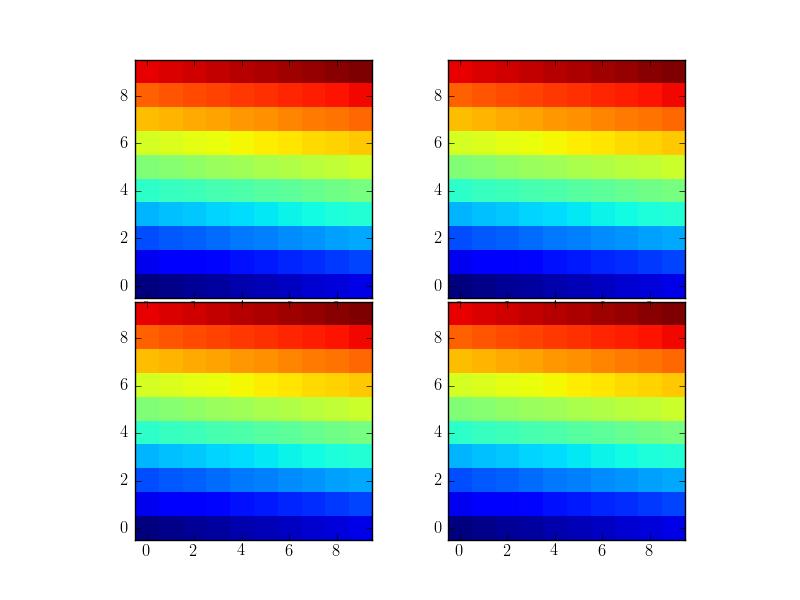
Axes w/ a fixed aspec ratio
Axes positions are specified in normalized figure coordinate
- This is good for interactive mode.
- But for axes with fixed aspect ratio, it's difficult to control the spacing between axes.
Presenter Notes
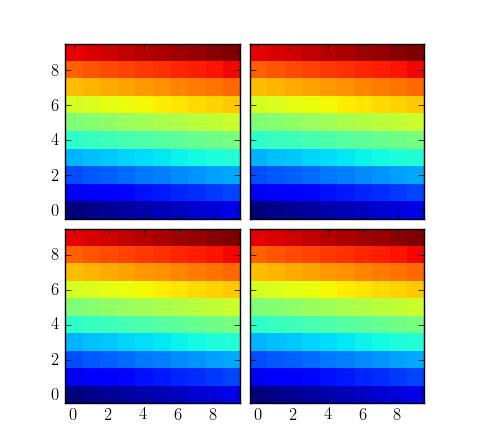
fig, ax_list = subplots(2,2)

arr = np.arange(100).reshape((10,10))

for ax in ax_list.flat:
    ax.imshow(arr)

plt.subplots_adjust(wspace=0.02, hspace=0.02)
Presenter Notes
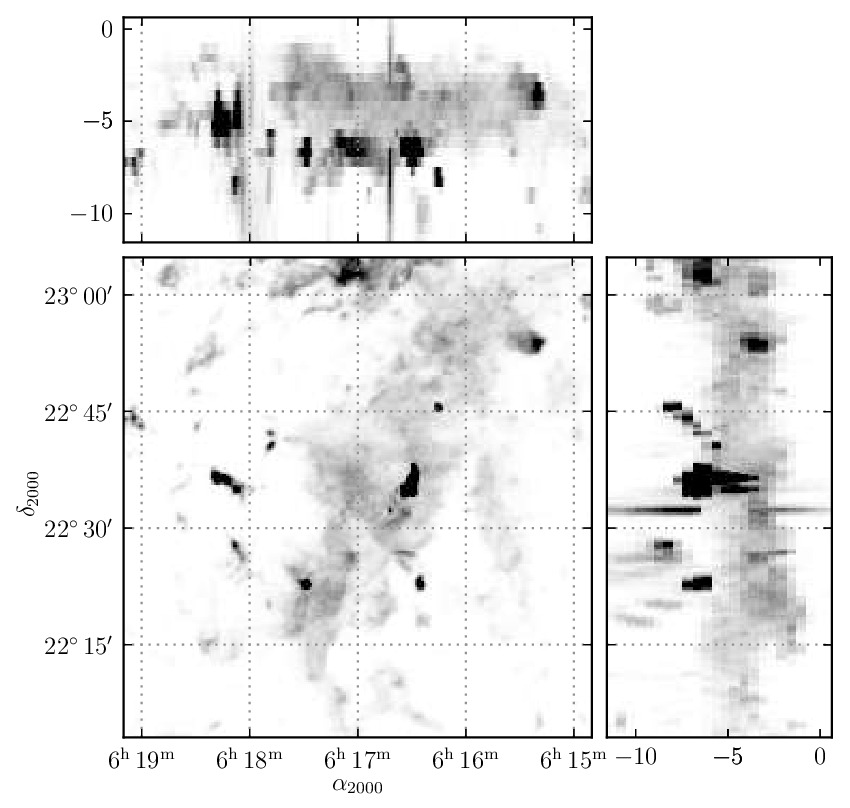
mpl_toolkits.axes_grid1
http://matplotlib.sourceforge.net/mpl_toolkits/axes_grid/index.html#toolkit-axesgrid-index
from mpl_toolkits.axes_grid1 import ImageGrid

fig = plt.figure(1)
grid = ImageGrid(fig, 111, # similar to subplot(111)
                 nrows_ncols = (2, 2), # creates 2x2 grid of axes
                 axes_pad=0.1, # pad between axes in inch.
                 )
for ax in grid: # sequence-like interface for axes in the grid
   ax.imshow(arr)
Presenter Notes

Presenter Notes
Presenter Notes

Presenter Notes

Presenter Notes

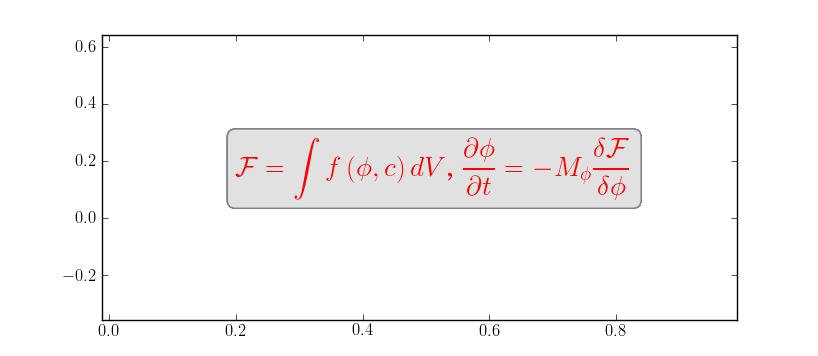
Text & TeX
matplotlib support TeX rendering (using TeX)
tex_string = r'$\displaystyle \mathcal{F} = \int f\left( \phi, c \right)' \
             r'dV$, $\displaystyle\frac{ \partial \phi } { \partial t }' \
             r'= -M_{ \phi } \frac{ \delta \mathcal{F} }' \
             r'{ \delta \phi }$'

bbox_props = dict(boxstyle="round", fc="0.9", ec="0.5", alpha=0.9)

plt.text(0.2, 0.15, tex_string,
         {'color' : 'r', 'fontsize' : 20},
         bbox=bbox_props)
Presenter Notes
Annotation
http://matplotlib.sourceforge.net/users/annotations_guide.html
Box around Text

Presenter Notes
Presenter Notes
Annotation w/ Arrows
plt.plot([0.2], [0.2], "o")
ann = plt.annotate("Test",
                   xy=(0.2, 0.2), xycoords='data',
                   xytext=(50, 50), textcoords='offset points',
                   arrowprops=dict(arrowstyle="->", shrinkB=10,
                                   connectionstyle="angle3"),
                   size=30
                   )
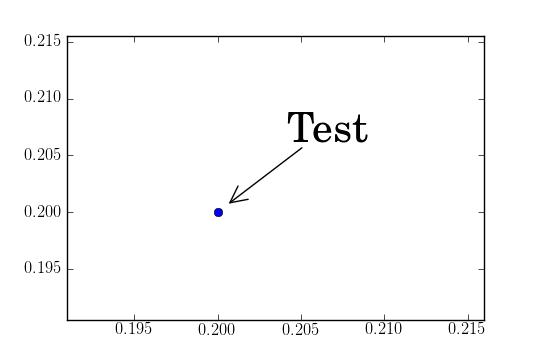
annoation are dragable.
ann.dragable()
Presenter Notes

Presenter Notes

Presenter Notes

Presenter Notes

Presenter Notes
patheffects
- override draw_path method of the backends
from matplotlib.patheffects import withStroke
imshow([[1,2],[2,3]], interpolation="bilinear")
txt = annotate("test", (1., 1.), (0., 0),
               arrowprops=dict(arrowstyle="->",
                               connectionstyle="angle3", lw=2),
               size=20, ha="center")
txt.set_path_effects([withStroke(linewidth=3, foreground="w")])
txt.arrow_patch.set_path_effects([withStroke(linewidth=5, foreground="w")])

Presenter Notes
Legend
- legend of complex plots : new in v1.1
- example

Presenter Notes
- http://matplotlib.sourceforge.net/users/legend_guide.html#legend-location
- use bbox_to_anchor and bbox_transform parameters to adjust the legend location.

Presenter Notes
OffsetBox
- can be used for artists w/ mixed coordinate systems
- size : data transform
- position : normalized axes transform
- http://matplotlib.sourceforge.net/examples/axes_grid/simple_anchored_artists.html

Presenter Notes

Presenter Notes
Agg filter
demo_aggfilter.py

Presenter Notes
mplot3d

Presenter Notes
axisartist

Presenter Notes

Presenter Notes
Presenter Notes
Presenter Notes
Presenter Notes
Presenter Notes